Overview
Package auditor is a tool for model-agnostic validation. Implemented techniques facilitate assessing and comparing the goodness of fit and performance of models. In addition, they may be used for the analysis of the similarity of residuals and for the identification of outliers and influential observations. The examination is carried out by diagnostic scores and visual verification. Due to the flexible and consistent grammar, it is simple to validate models of any classes.
An up-to-date paper about auditor and a shorter version in The R-Journal.
auditor is a part of DrWhy collection of tools for Visual Exploration, Explanation and Debugging of Predictive Models.
auditor’s pipeline: model %>% DALEX::explain() %>% plot(type=…)
Installation
Stable version from CRAN:
install.packages("auditor")Developer version from GitHub:
source("https://install-github.me/ModelOriented/auditor")

# or with the devtools package
devtools::install_github("ModelOriented/auditor")
Demo
Run the code below or try the auditor.
library(auditor)
library(randomForest)
data(mtcars)

# fitting models
model_lm <- lm(mpg ~ ., data = mtcars)
set.seed(123)
model_rf <- randomForest(mpg ~ ., data = mtcars)

# creating objects with 'explain' function from the package DALEX
# that contains all necessary components required for further processing
exp_lm <- DALEX::explain(model_lm, data = mtcars, y = mtcars$mpg,  verbose = FALSE)
exp_rf <- DALEX::explain(model_rf, data = mtcars, y = mtcars$mpg, label = "rf", verbose = FALSE)

# create explanation  objects
mr_lm <- model_residual(exp_lm)
mr_rf <- model_residual(exp_rf)

# generating plots
plot_residual(mr_lm, mr_rf, variable = "wt", smooth = TRUE)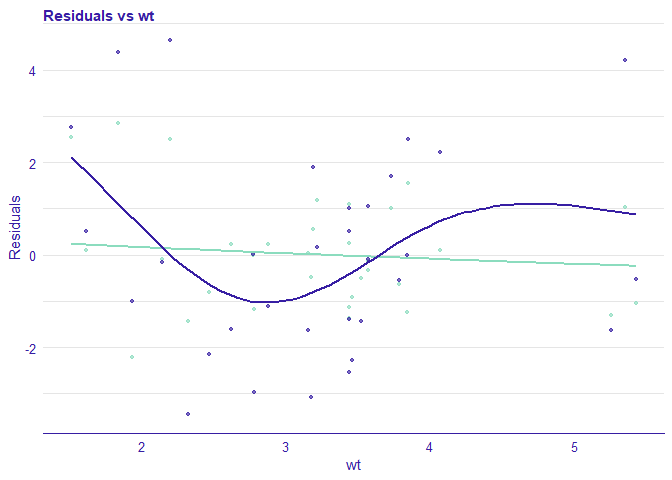
More Resources
A preprint of the article about auditor is available on arxiv.
Short overview of plots
Column type contains character that should be passed to parameter type= when using plot() function. Regr and Class columns indicate whether plot can be used for regression and classification models.
| Name of a plot | Function | Interactive version | Type | Regr | Class |
|---|---|---|---|---|---|
| Autocorrelation Function | plot_acf() | plotD3_acf() | “acf” | yes | yes |
| Autocorrelation | plot_autocorrelation() | plotD3_autocorrelation() | “autocorrelation” | yes | yes |
| Influence of Observations | plot_cooksdistance() | plotD3_cooksdistance() | “cooksdistance” | yes | yes |
| Half-Normal | plot_halfnormal() | plotD3_halfnormal() | “halfnormal” | yes | yes |
| LIFT Chart | plot_lift() | plotD3_lift() | “lift” | no | yes |
| Model Correlation | plot_correlation() | - | “correlation” | yes | yes |
| Principal Component Analysis of Models | plot_pca() | - | “pca” | yes | yes |
| Model Ranking Radar Plot | plot_radar() | - | “radar” | yes | yes |
| Predicted Response vs Actual or Variable Values | plot_prediction() | plotD3_prediction() | “prediction” | yes | yes |
| Regression Error Characteristic Curve (REC) | plot_rec() | plotD3_rec() | “rec” | yes | yes |
| Plot Residuals vs Actual, Fitted or Variable Values | plot_residual() | plotD3_residual() | “residual” | yes | yes |
| Residual Boxplot | plot_residual_boxplot() | - | “residual_boxplot” | yes | yes |
| Residual Density | plot_residual_density() | - | “residual_density” | yes | yes |
| Receiver Operating Characteristic (ROC) Curve | plot_roc() | plotD3_roc | “roc” | no | yes |
| Regression Receiver Operating Characteristic (RROC) | plot_rroc() | plotD3_rroc | “rroc” | yes | yes |
| Scale-Location Plot | plot_scalelocation() | plotD3_scalelocation() | “scalelocation” | yes | yes |
| Two-sided Cumulative Distribution Function | plot_tsecdf() | - | “tsecdf” | yes | yes |