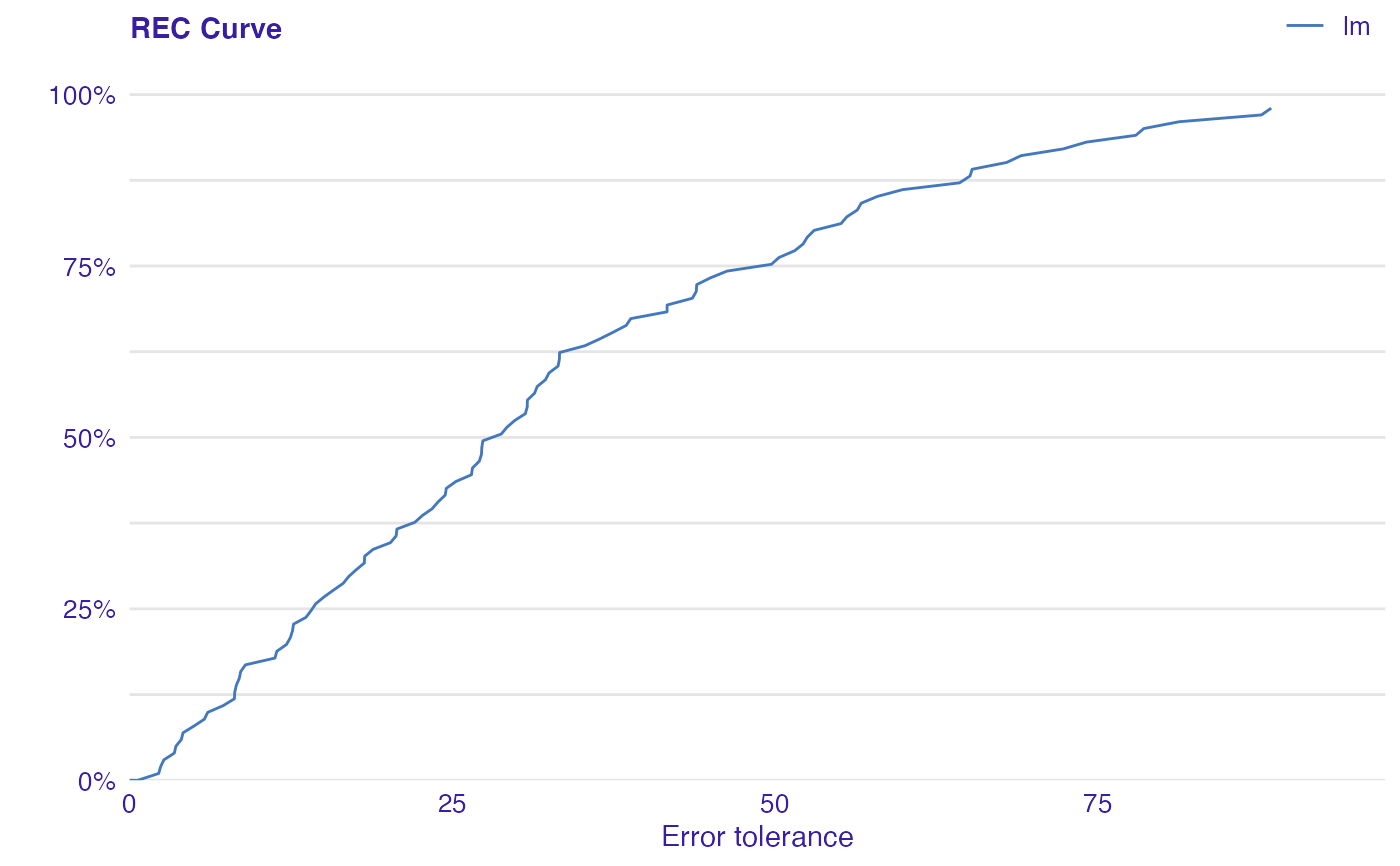
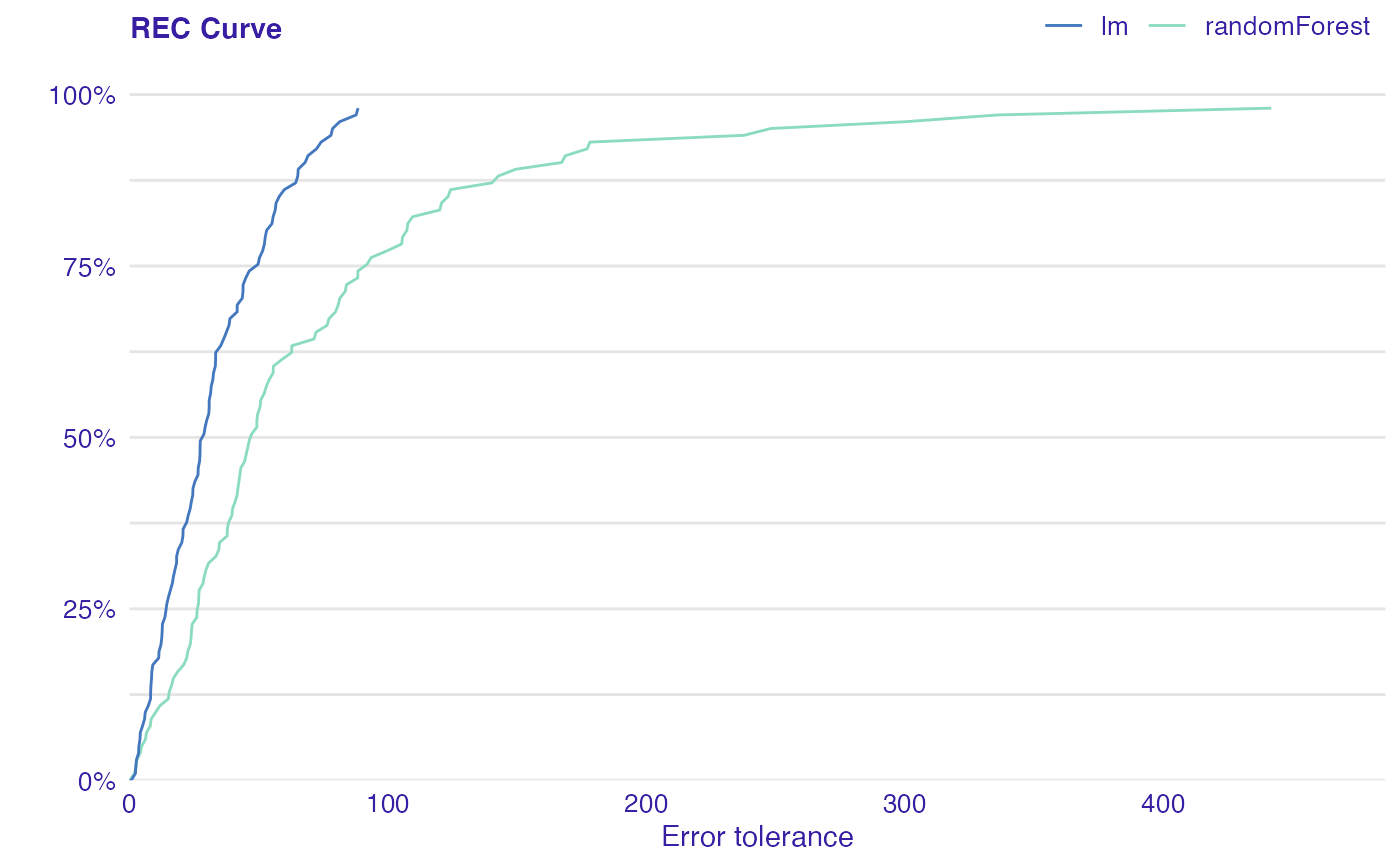
Error Characteristic curves are a generalization of ROC curves. On the x axis of the plot there is an error tolerance and on the y axis there is a percentage of observations predicted within the given tolerance.
plot_rec(object, ...)

plotREC(object, ...)
Arguments
| object | An object of class |
|---|---|
| ... | Other |
Value
A ggplot object.
Details
REC curve estimates the Cumulative Distribution Function (CDF) of the error
Area Over the REC Curve (REC) is a biased estimate of the expected error
References
Bi J., Bennett K.P. (2003). Regression error characteristic curves, in: Twentieth International Conference on Machine Learning (ICML-2003), Washington, DC.
See also
Examples
dragons <- DALEX::dragons[1:100, ] # fit a model model_lm <- lm(life_length ~ ., data = dragons) # use DALEX package to wrap up a model into explainer lm_audit <- audit(model_lm, data = dragons, y = dragons$life_length)#> Preparation of a new explainer is initiated #> -> model label : lm ( default ) #> -> data : 100 rows 8 cols #> -> target variable : 100 values #> -> predict function : yhat.lm will be used ( default ) #> -> predicted values : No value for predict function target column. ( default ) #> -> model_info : package stats , ver. 4.1.1 , task regression ( default ) #> -> predicted values : numerical, min = 585.8311 , mean = 1347.787 , max = 2942.307 #> -> residual function : difference between y and yhat ( default ) #> -> residuals : numerical, min = -88.41755 , mean = -1.489291e-13 , max = 77.92805 #> A new explainer has been created!library(randomForest) model_rf <- randomForest(life_length~., data = dragons) rf_audit <- audit(model_rf, data = dragons, y = dragons$life_length)#> Preparation of a new explainer is initiated #> -> model label : randomForest ( default ) #> -> data : 100 rows 8 cols #> -> target variable : 100 values #> -> predict function : yhat.randomForest will be used ( default ) #> -> predicted values : No value for predict function target column. ( default ) #> -> model_info : package randomForest , ver. 4.6.14 , task regression ( default ) #> -> predicted values : numerical, min = 765.3002 , mean = 1342.32 , max = 2456.633 #> -> residual function : difference between y and yhat ( default ) #> -> residuals : numerical, min = -178.109 , mean = 5.466688 , max = 441.7877 #> A new explainer has been created!