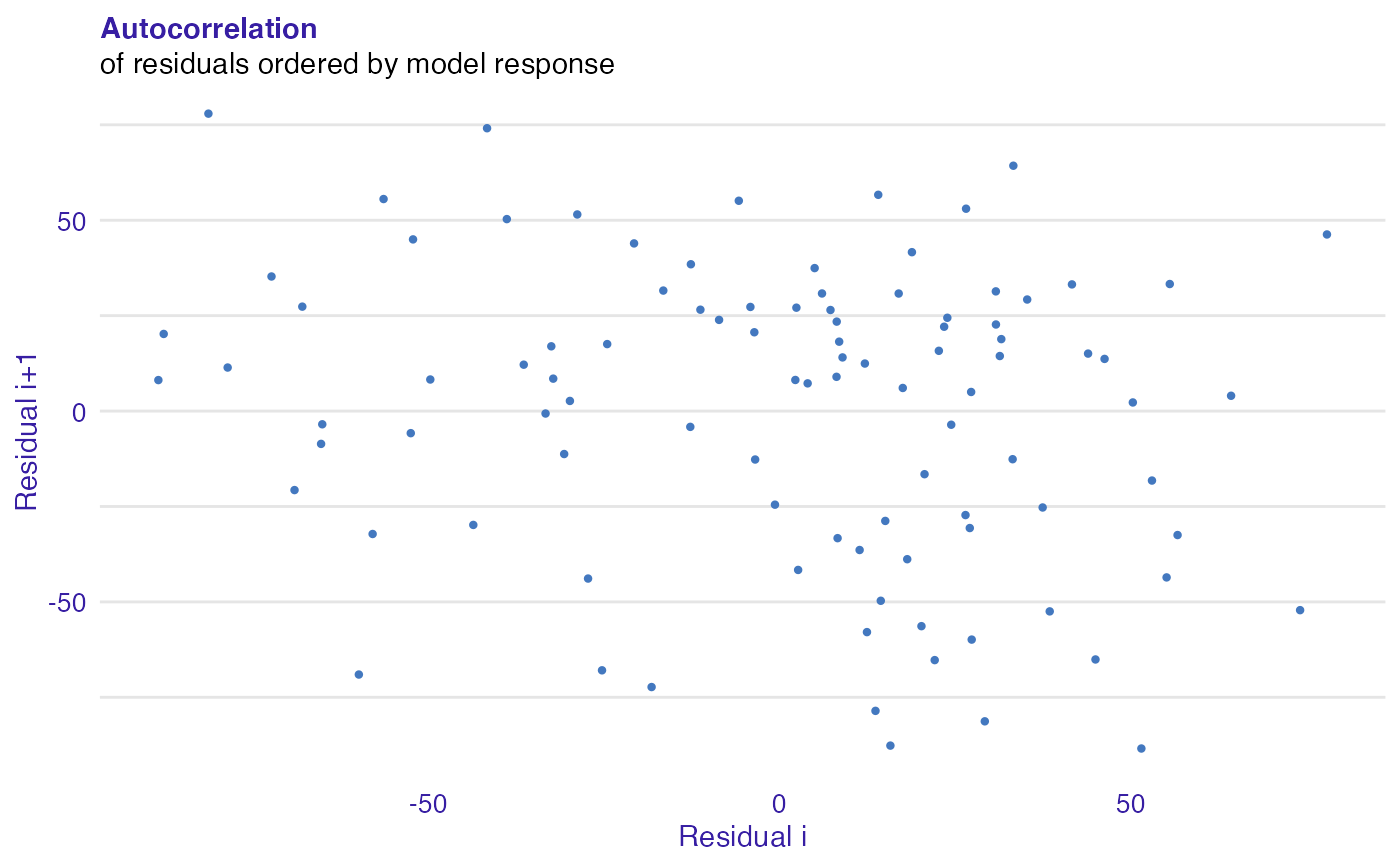
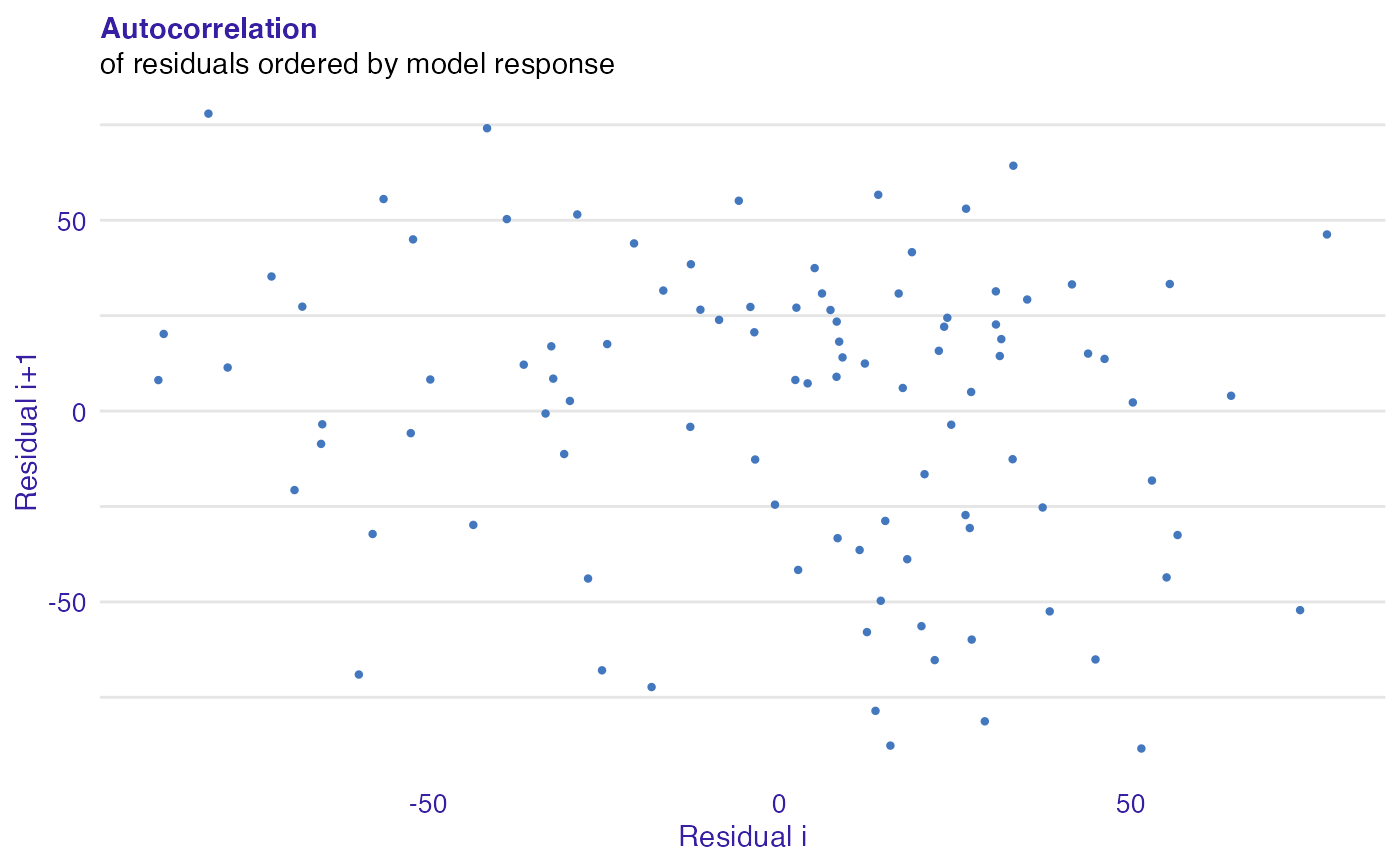
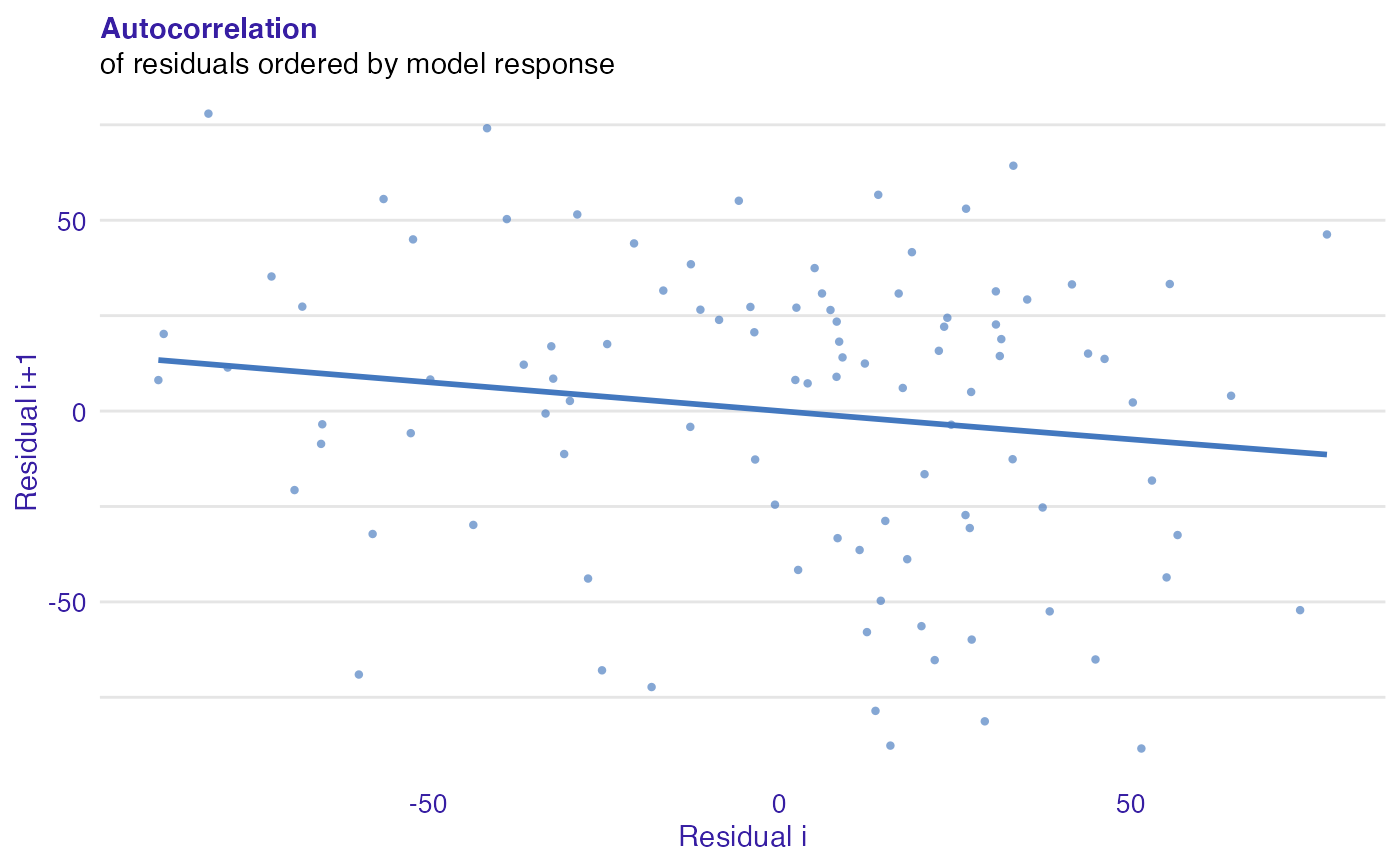
Plot of i-th residual vs i+1-th residual.
plot_autocorrelation(object, ..., variable = "_y_hat_", smooth = FALSE)

plotAutocorrelation(object, ..., variable, smooth = FALSE)
Arguments
| object | An object of class |
|---|---|
| ... | Other |
| variable | Name of variable to order residuals on a plot.
If |
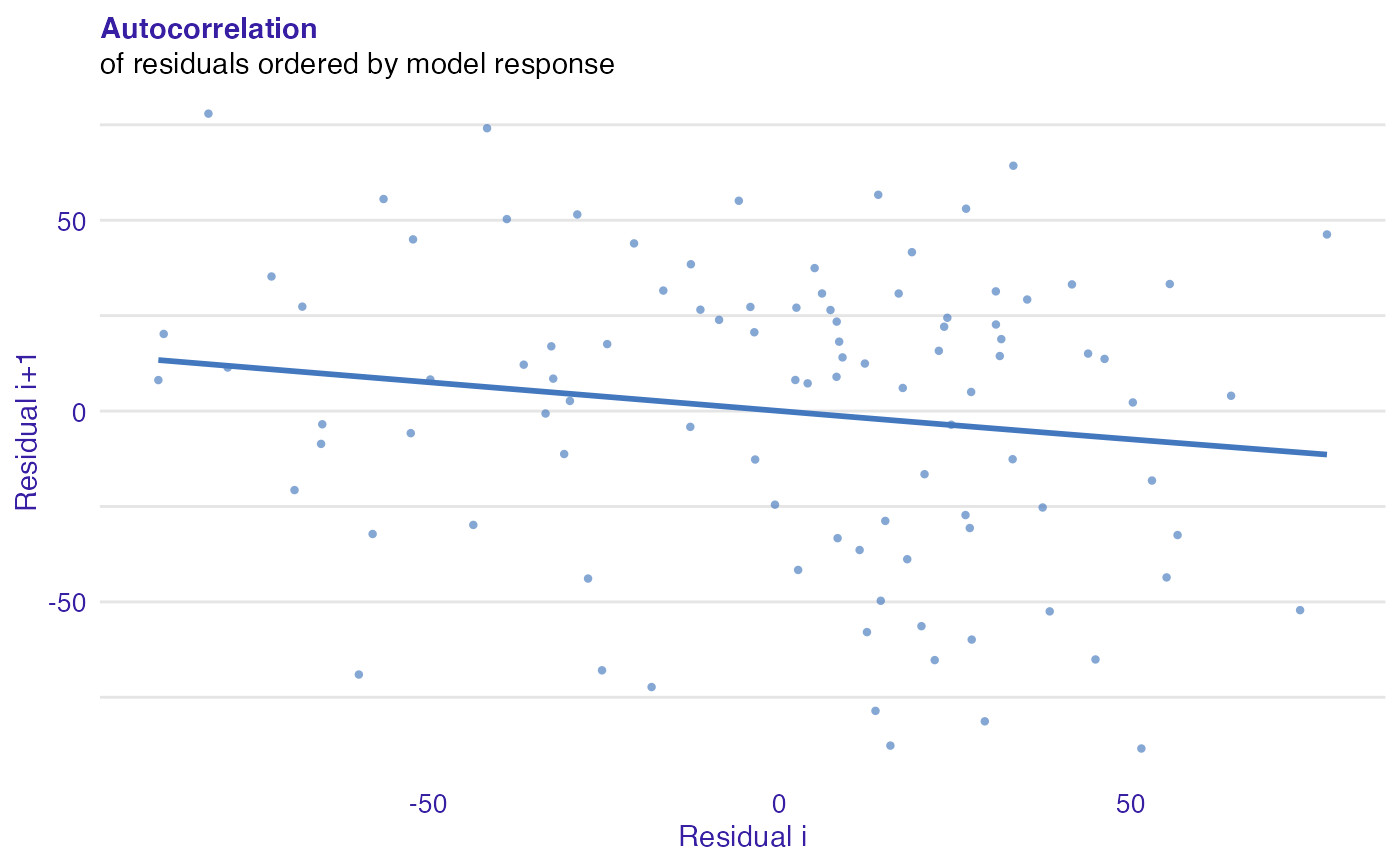
| smooth | Logical, if TRUE smooth line will be added. |
Value
A ggplot object.
Examples
dragons <- DALEX::dragons[1:100, ] # fit a model model_lm <- lm(life_length ~ ., data = dragons) lm_audit <- audit(model_lm, data = dragons, y = dragons$life_length)#> Preparation of a new explainer is initiated #> -> model label : lm ( default ) #> -> data : 100 rows 8 cols #> -> target variable : 100 values #> -> predict function : yhat.lm will be used ( default ) #> -> predicted values : No value for predict function target column. ( default ) #> -> model_info : package stats , ver. 4.1.1 , task regression ( default ) #> -> predicted values : numerical, min = 585.8311 , mean = 1347.787 , max = 2942.307 #> -> residual function : difference between y and yhat ( default ) #> -> residuals : numerical, min = -88.41755 , mean = -1.489291e-13 , max = 77.92805 #> A new explainer has been created!# validate a model with auditor mr_lm <- model_residual(lm_audit) # plot results plot_autocorrelation(mr_lm)plot_autocorrelation(mr_lm, smooth = TRUE)


