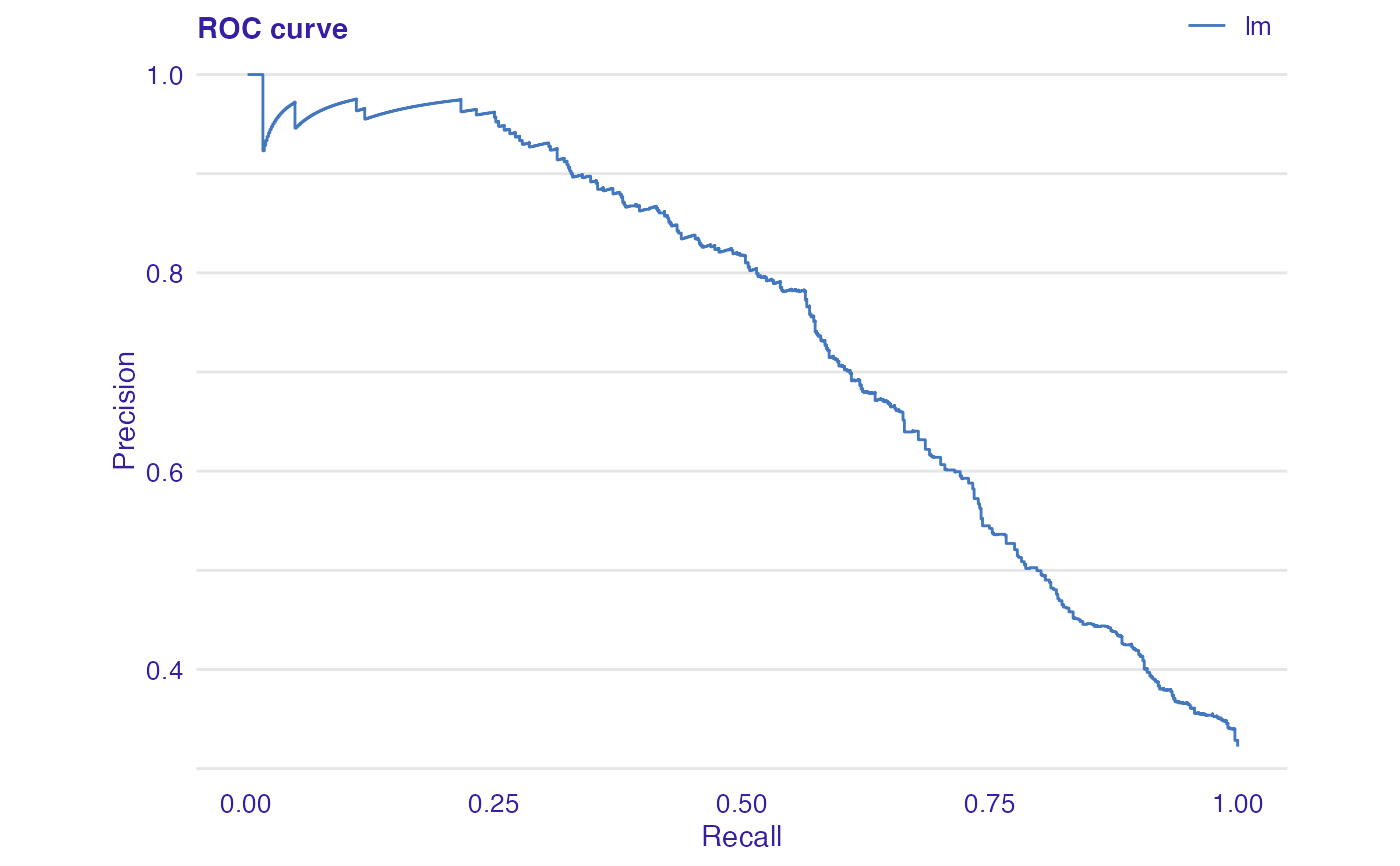
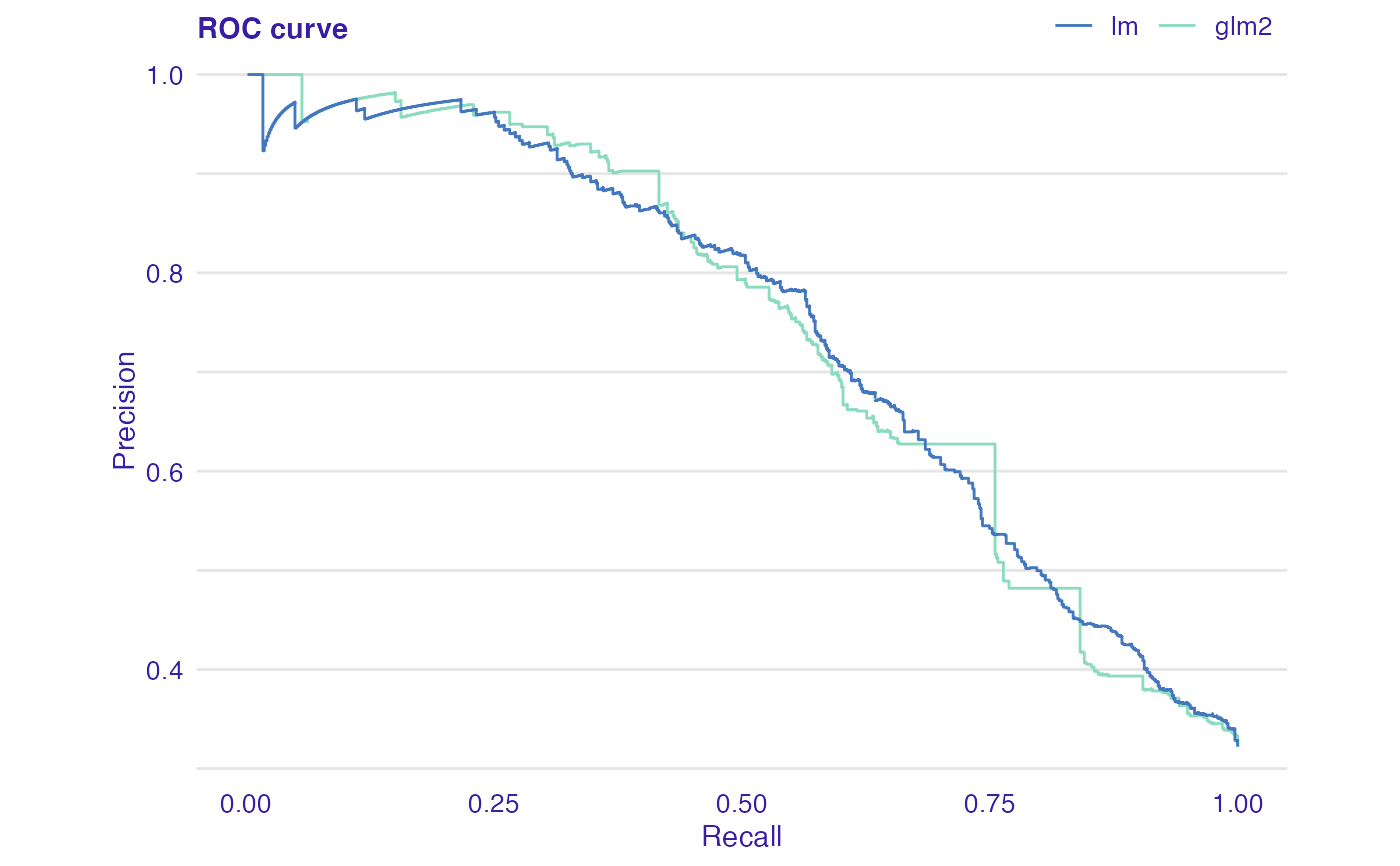
Precision-Recall Curve summarize the trade-off between the true positive rate and the positive predictive value for a model. It is useful for measuring performance and comparing classificators.
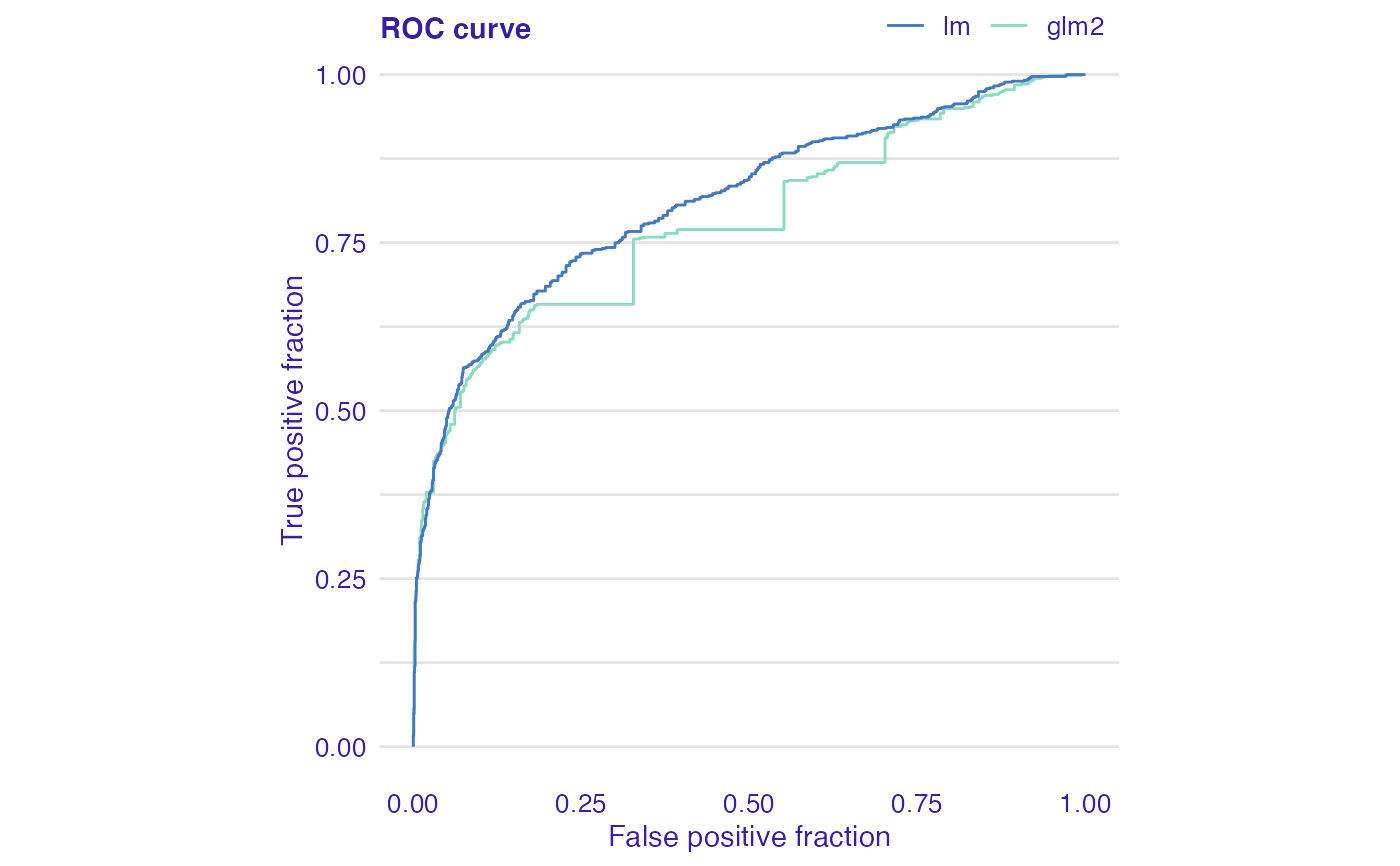
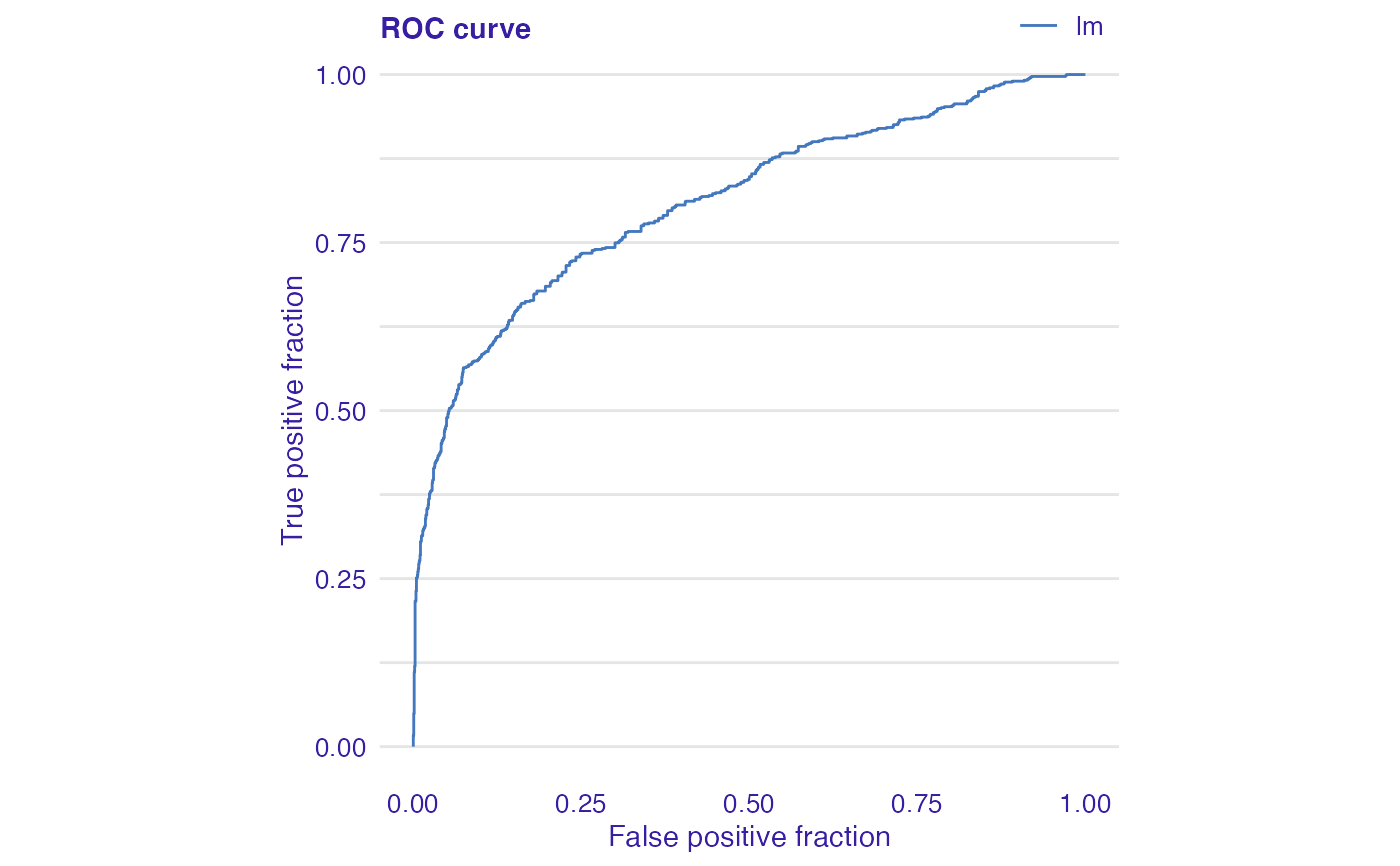
Receiver Operating Characteristic Curve is a plot of the true positive rate (TPR) against the false positive rate (FPR) for the different thresholds. It is useful for measuring and comparing the accuracy of the classificators.
plot_prc(object, ..., nlabel = NULL)

plot_roc(object, ..., nlabel = NULL)

plotROC(object, ..., nlabel = NULL)
Arguments
| object | An object of class |
|---|---|
| ... | Other |
| nlabel | Number of cutoff points to show on the plot. Default is |
Value
A ggplot object.
A ggplot object.
See also
Examples
library(DALEX) # fit a model model_glm <- glm(survived ~ ., family = binomial, data = titanic_imputed) glm_audit <- audit(model_glm, data = titanic_imputed, y = titanic_imputed$survived)#> Preparation of a new explainer is initiated #> -> model label : lm ( default ) #> -> data : 2207 rows 8 cols #> -> target variable : 2207 values #> -> predict function : yhat.glm will be used ( default ) #> -> predicted values : No value for predict function target column. ( default ) #> -> model_info : package stats , ver. 4.1.1 , task classification ( default ) #> -> predicted values : numerical, min = 0.008128381 , mean = 0.3221568 , max = 0.9731431 #> -> residual function : difference between y and yhat ( default ) #> -> residuals : numerical, min = -0.9628583 , mean = -2.569729e-10 , max = 0.9663346 #> A new explainer has been created!# validate a model with auditor eva_glm <- model_evaluation(glm_audit) # plot results plot_prc(eva_glm)#add second model model_glm_2 <- glm(survived ~ .-age, family = binomial, data = titanic_imputed) glm_audit_2 <- audit(model_glm_2, data = titanic_imputed, y = titanic_imputed$survived, label = "glm2")#> Preparation of a new explainer is initiated #> -> model label : glm2 #> -> data : 2207 rows 8 cols #> -> target variable : 2207 values #> -> predict function : yhat.glm will be used ( default ) #> -> predicted values : No value for predict function target column. ( default ) #> -> model_info : package stats , ver. 4.1.1 , task classification ( default ) #> -> predicted values : numerical, min = 0.01618585 , mean = 0.3221568 , max = 0.9628841 #> -> residual function : difference between y and yhat ( default ) #> -> residuals : numerical, min = -0.9354237 , mean = -1.981381e-10 , max = 0.9654417 #> A new explainer has been created!data(titanic_imputed, package = "DALEX") # fit a model model_glm <- glm(survived ~ ., family = binomial, data = titanic_imputed) # use DALEX package to wrap up a model into explainer glm_audit <- audit(model_glm, data = titanic_imputed, y = titanic_imputed$survived)#> Preparation of a new explainer is initiated #> -> model label : lm ( default ) #> -> data : 2207 rows 8 cols #> -> target variable : 2207 values #> -> predict function : yhat.glm will be used ( default ) #> -> predicted values : No value for predict function target column. ( default ) #> -> model_info : package stats , ver. 4.1.1 , task classification ( default ) #> -> predicted values : numerical, min = 0.008128381 , mean = 0.3221568 , max = 0.9731431 #> -> residual function : difference between y and yhat ( default ) #> -> residuals : numerical, min = -0.9628583 , mean = -2.569729e-10 , max = 0.9663346 #> A new explainer has been created!# validate a model with auditor eva_glm <- model_evaluation(glm_audit) # plot results plot_roc(eva_glm)#add second model model_glm_2 <- glm(survived ~ .-age, family = binomial, data = titanic_imputed) glm_audit_2 <- audit(model_glm_2, data = titanic_imputed, y = titanic_imputed$survived, label = "glm2")#> Preparation of a new explainer is initiated #> -> model label : glm2 #> -> data : 2207 rows 8 cols #> -> target variable : 2207 values #> -> predict function : yhat.glm will be used ( default ) #> -> predicted values : No value for predict function target column. ( default ) #> -> model_info : package stats , ver. 4.1.1 , task classification ( default ) #> -> predicted values : numerical, min = 0.01618585 , mean = 0.3221568 , max = 0.9628841 #> -> residual function : difference between y and yhat ( default ) #> -> residuals : numerical, min = -0.9354237 , mean = -1.981381e-10 , max = 0.9654417 #> A new explainer has been created!