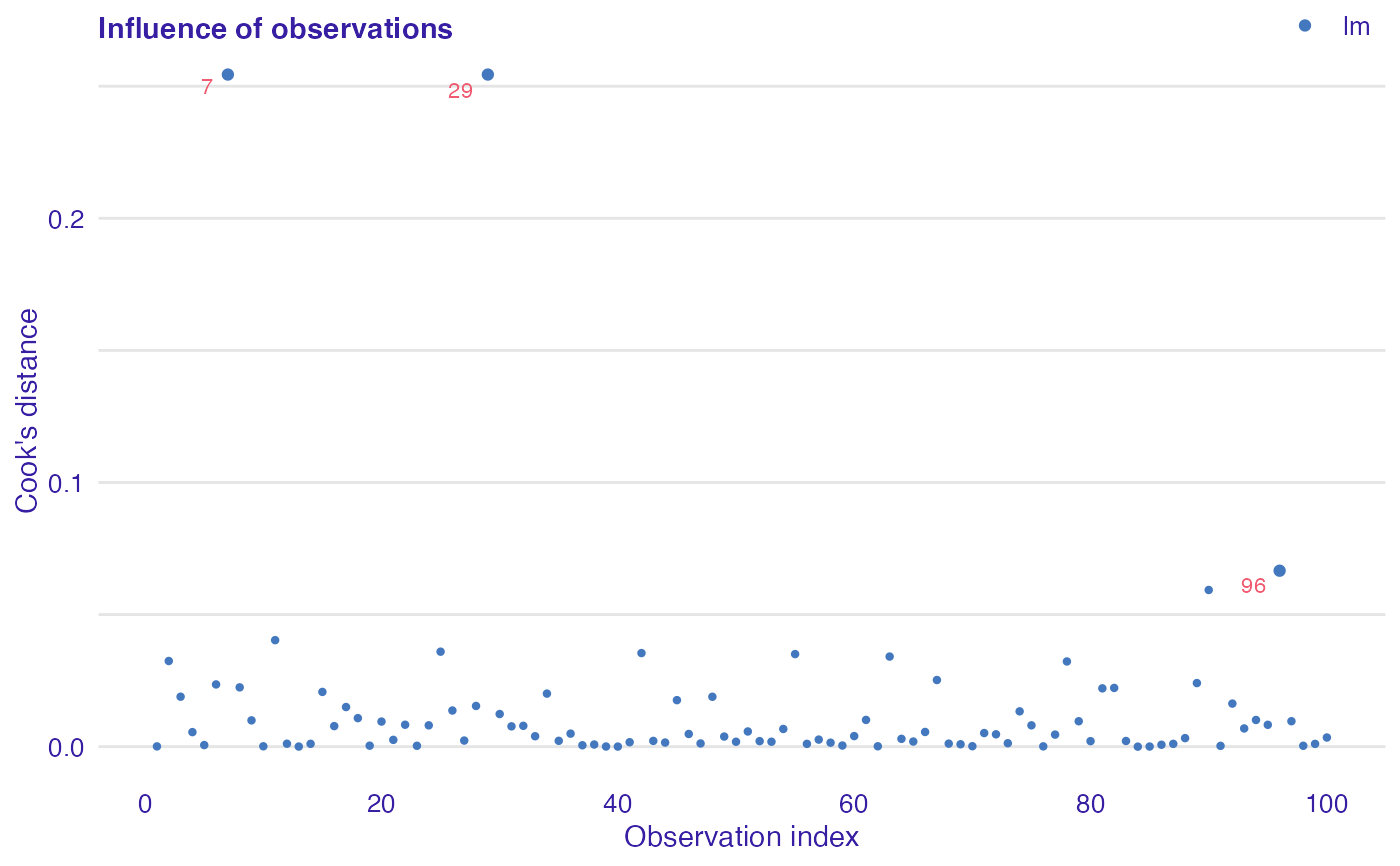
Plot of Cook’s distances used for estimate the influence of an single observation.
plot_cooksdistance(object, ..., nlabel = 3)

plotCooksDistance(object, ..., nlabel = 3)
Arguments
| object | An object of class |
|---|---|
| ... | Other objects of class |
| nlabel | Number of observations with the biggest Cook's distances to be labeled. |
Value
A ggplot object.
Details
Cook’s distance is a tool for identifying observations that may negatively affect the model. They may be also used for indicating regions of the design space where it would be good to obtain more observations. Data points indicated by Cook’s distances are worth checking for validity.
Cook’s Distances are calculated by removing the i-th observation from the data and recalculating the model. It shows how much all the values in the model change when the i-th observation is removed.
For model classes other than lm and glm the distances are computed directly from the definition.
References
Cook, R. Dennis (1977). "Detection of Influential Observations in Linear Regression". doi:10.2307/1268249.
Examples
dragons <- DALEX::dragons[1:100, ] # fit a model model_lm <- lm(life_length ~ ., data = dragons) lm_audit <- audit(model_lm, data = dragons, y = dragons$life_length)#> Preparation of a new explainer is initiated #> -> model label : lm ( default ) #> -> data : 100 rows 8 cols #> -> target variable : 100 values #> -> predict function : yhat.lm will be used ( default ) #> -> predicted values : No value for predict function target column. ( default ) #> -> model_info : package stats , ver. 4.1.1 , task regression ( default ) #> -> predicted values : numerical, min = 585.8311 , mean = 1347.787 , max = 2942.307 #> -> residual function : difference between y and yhat ( default ) #> -> residuals : numerical, min = -88.41755 , mean = -1.489291e-13 , max = 77.92805 #> A new explainer has been created!# validate a model with auditor library(auditor) cd_lm <- model_cooksdistance(lm_audit) # plot results plot_cooksdistance(cd_lm)