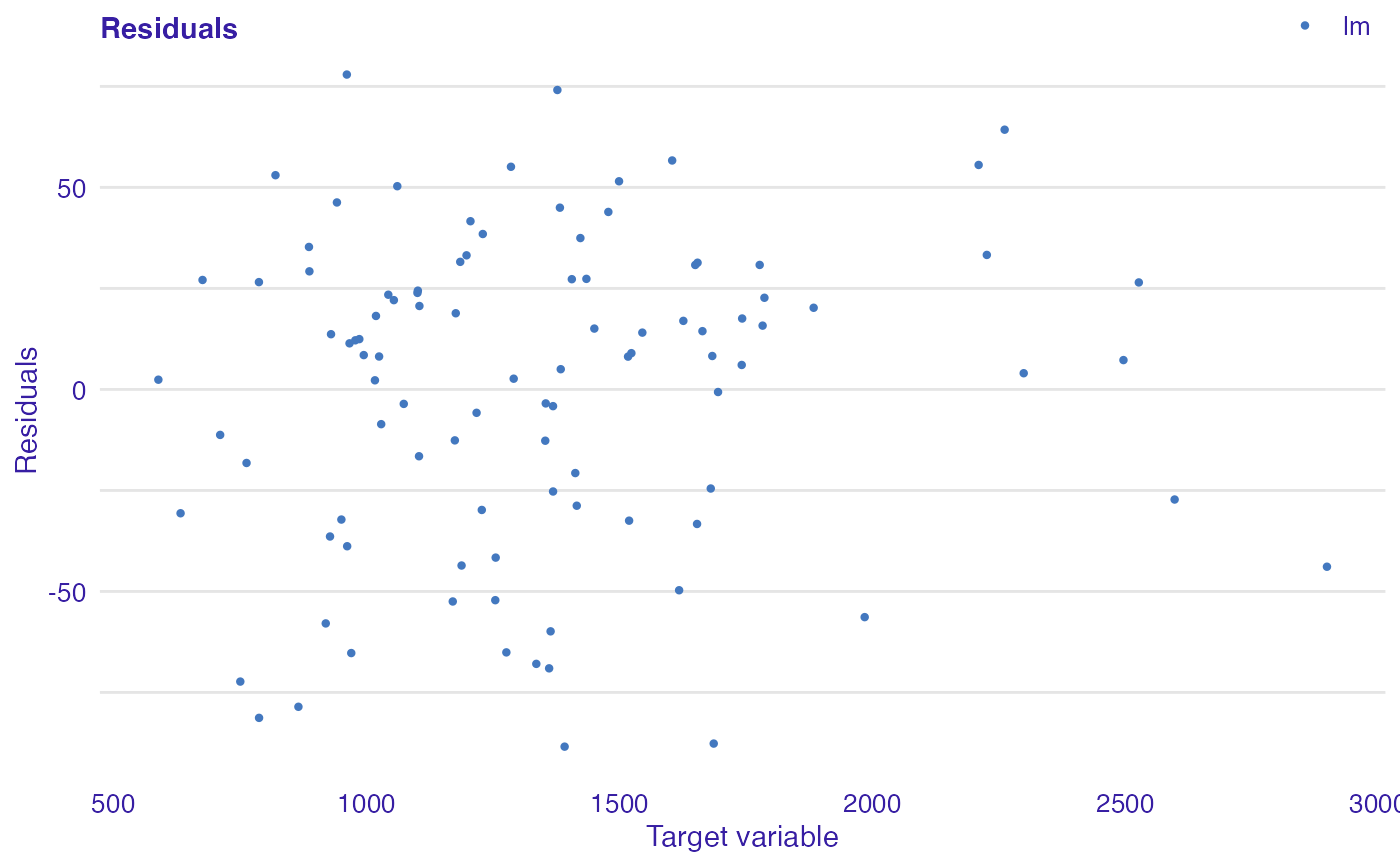
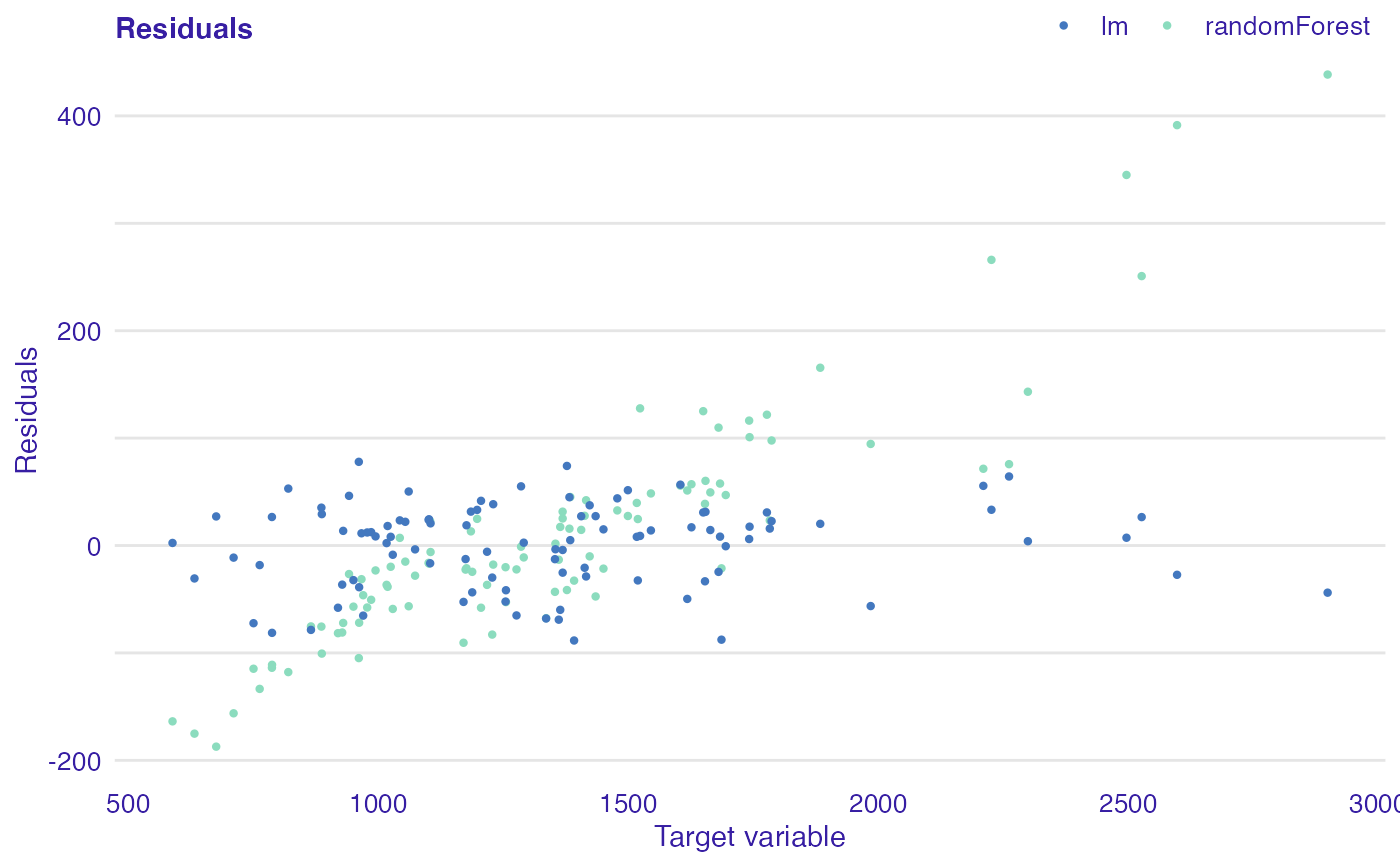
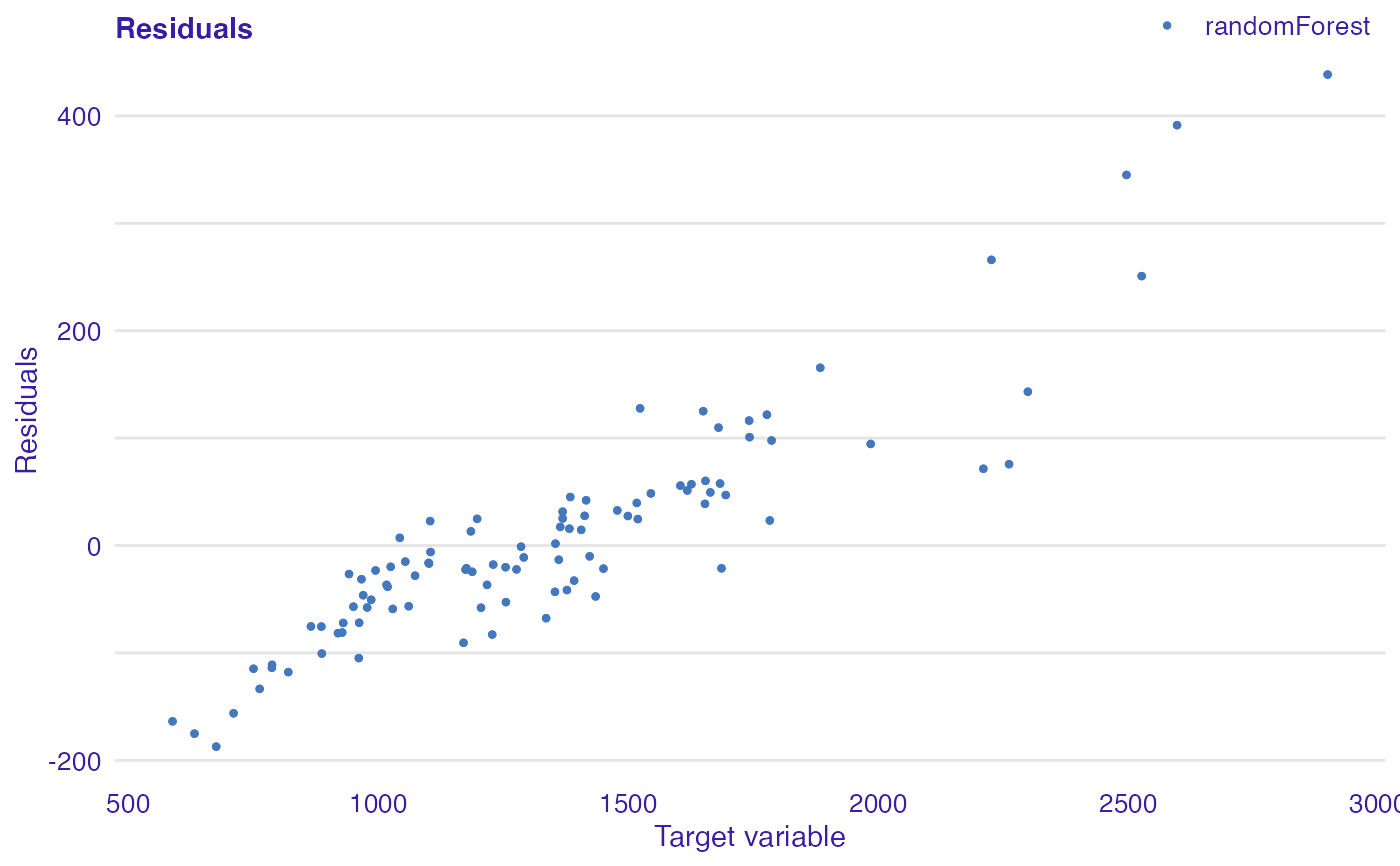
A plot of residuals against fitted values, observed values or any variable.
plot_residual(
  object,
  ...,
  variable = "_y_",
  smooth = FALSE,
  std_residuals = FALSE,
  nlabel = 0
)

plotResidual(
  object,
  ...,
  variable = NULL,
  smooth = FALSE,
  std_residuals = FALSE,
  nlabel = 0
)
Arguments
| object | An object of class |
|---|---|
| ... | Other |
| variable | Name of variable to order residuals on a plot.
If |
| smooth | Logical, indicates whenever smoothed lines should be added. By default it's |
| std_residuals | Logical, indicates whenever standardized residuals should be used. |
| nlabel | Number of observations with the biggest absolute values of residuals to be labeled. |
Examples
dragons <- DALEX::dragons[1:100, ] # fit a model model_lm <- lm(life_length ~ ., data = dragons) lm_audit <- audit(model_lm, data = dragons, y = dragons$life_length)#> Preparation of a new explainer is initiated #> -> model label : lm ( default ) #> -> data : 100 rows 8 cols #> -> target variable : 100 values #> -> predict function : yhat.lm will be used ( default ) #> -> predicted values : No value for predict function target column. ( default ) #> -> model_info : package stats , ver. 4.1.1 , task regression ( default ) #> -> predicted values : numerical, min = 585.8311 , mean = 1347.787 , max = 2942.307 #> -> residual function : difference between y and yhat ( default ) #> -> residuals : numerical, min = -88.41755 , mean = -1.489291e-13 , max = 77.92805 #> A new explainer has been created!# validate a model with auditor mr_lm <- model_residual(lm_audit) # plot results plot_residual(mr_lm)library(randomForest) model_rf <- randomForest(life_length~., data = dragons) rf_audit <- audit(model_rf, data = dragons, y = dragons$life_length)#> Preparation of a new explainer is initiated #> -> model label : randomForest ( default ) #> -> data : 100 rows 8 cols #> -> target variable : 100 values #> -> predict function : yhat.randomForest will be used ( default ) #> -> predicted values : No value for predict function target column. ( default ) #> -> model_info : package randomForest , ver. 4.6.14 , task regression ( default ) #> -> predicted values : numerical, min = 751.9421 , mean = 1341.146 , max = 2459.921 #> -> residual function : difference between y and yhat ( default ) #> -> residuals : numerical, min = -187.2486 , mean = 6.640559 , max = 438.4994 #> A new explainer has been created!