Simulated data, real problem
Przemyslaw Biecek
2023-01-14
Source:vignettes/vignette_simulated.Rmd
vignette_simulated.RmdSimulated data
Let’s consider a following problem, the model is defined as
\[ y = x_1 * x_2 + x_2 \]
But \(x_1\) and \(x_2\) are correlated. How XAI methods work for such model?
# predict function for the model
the_model_predict <- function(m, x) {
 x$x1 * x$x2 + x$x2
}

# correlated variables
N <- 50
set.seed(1)
x1 <- runif(N, -5, 5)
x2 <- x1 + runif(N)/100
df <- data.frame(x1, x2)
Explainer for the models
In fact this model is defined by the predict function
the_model_predict. So it does not matter what is in the
first argument of the explain function.
#> Preparation of a new explainer is initiated
#>   -> model label       :  numeric  (  default  )
#>   -> data              :  50  rows  2  cols
#>   -> target variable   :  not specified! (  WARNING  )
#>   -> predict function  :  the_model_predict
#>   -> predicted values  :  No value for predict function target column. (  default  )
#>   -> model_info        :  package Model of class: numeric package unrecognized , ver. Unknown , task regression (  default  )
#>   -> model_info        :  Model info detected regression task but 'y' is a NULL .  (  WARNING  )
#>   -> model_info        :  By deafult regressions tasks supports only numercical 'y' parameter.
#>   -> model_info        :  Consider changing to numerical vector.
#>   -> model_info        :  Otherwise I will not be able to calculate residuals or loss function.
#>   -> predicted values  :  numerical, min =  -0.1726853 , mean =  7.70239 , max =  29.16158
#>   -> residual function :  difference between y and yhat (  default  )
#>   A new explainer has been created!
Ceteris paribus
Use the ceteris_paribus() function to see Ceteris
Paribus profiles. Clearly it’s not an additive model, as the effect of
\(x_1\) depends on \(x_2\).
library("ingredients")
library("ggplot2")

sample_rows <- data.frame(x1 = -5:5,
                          x2 = -5:5)

cp_model <- ceteris_paribus(explain_the_model, sample_rows)
plot(cp_model) +
  show_observations(cp_model) +
  ggtitle("Ceteris Paribus profiles")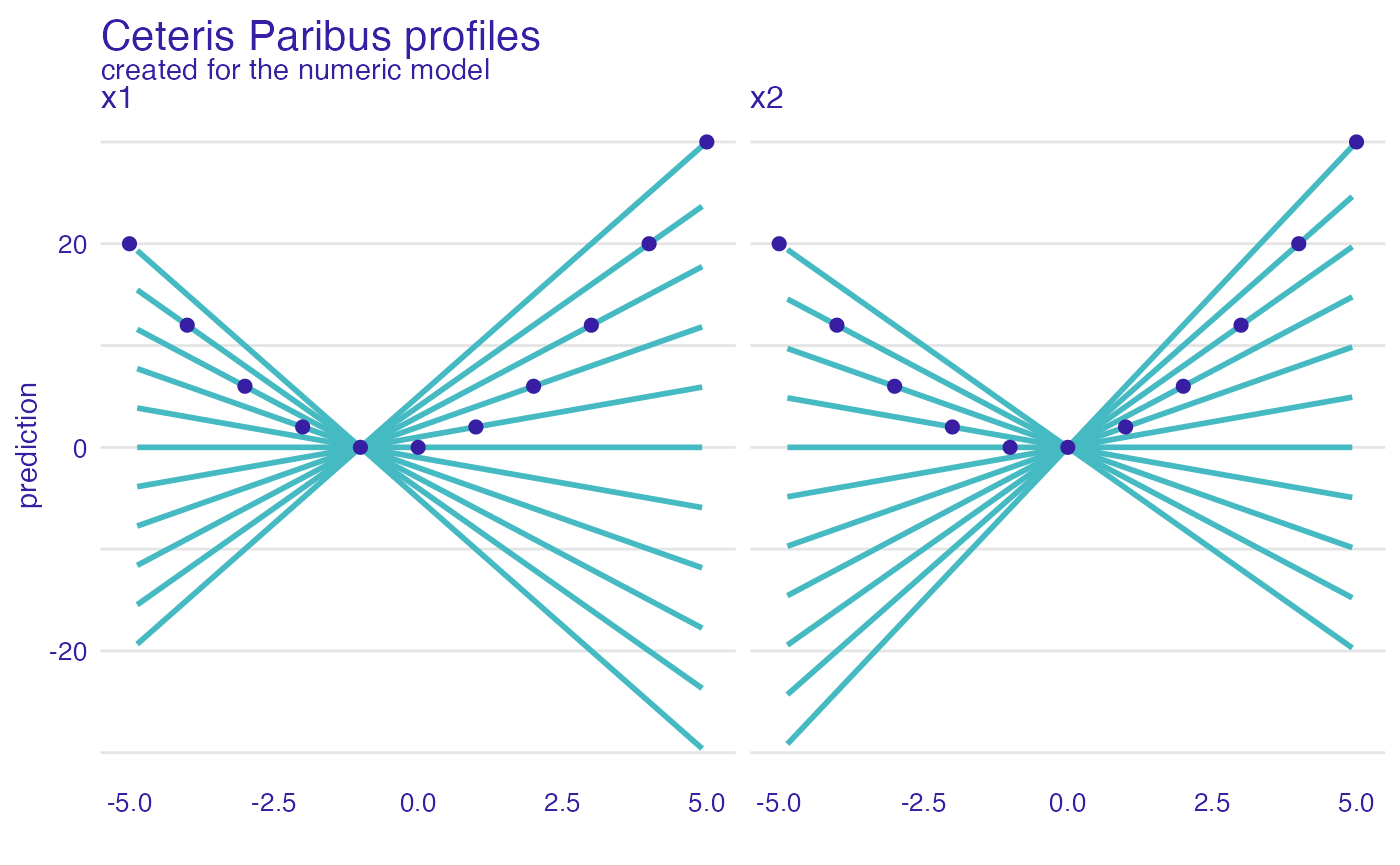
Dependence profiles
Lets try Partial Dependence profiles, Conditional Dependence profiles and Accumulated Local profiles. For the last two we can try different smoothing factors
pd_model <- partial_dependence(explain_the_model, variables = c("x1", "x2"))
pd_model$`_label_` = "PDP"

cd_model <- conditional_dependence(explain_the_model, variables = c("x1", "x2"))
cd_model$`_label_` = "CDP 0.25"

ad_model <- accumulated_dependence(explain_the_model, variables = c("x1", "x2"))
ad_model$`_label_` = "ALE 0.25"

plot(ad_model, cd_model, pd_model) +
  ggtitle("Feature effects - PDP, CDP, ALE")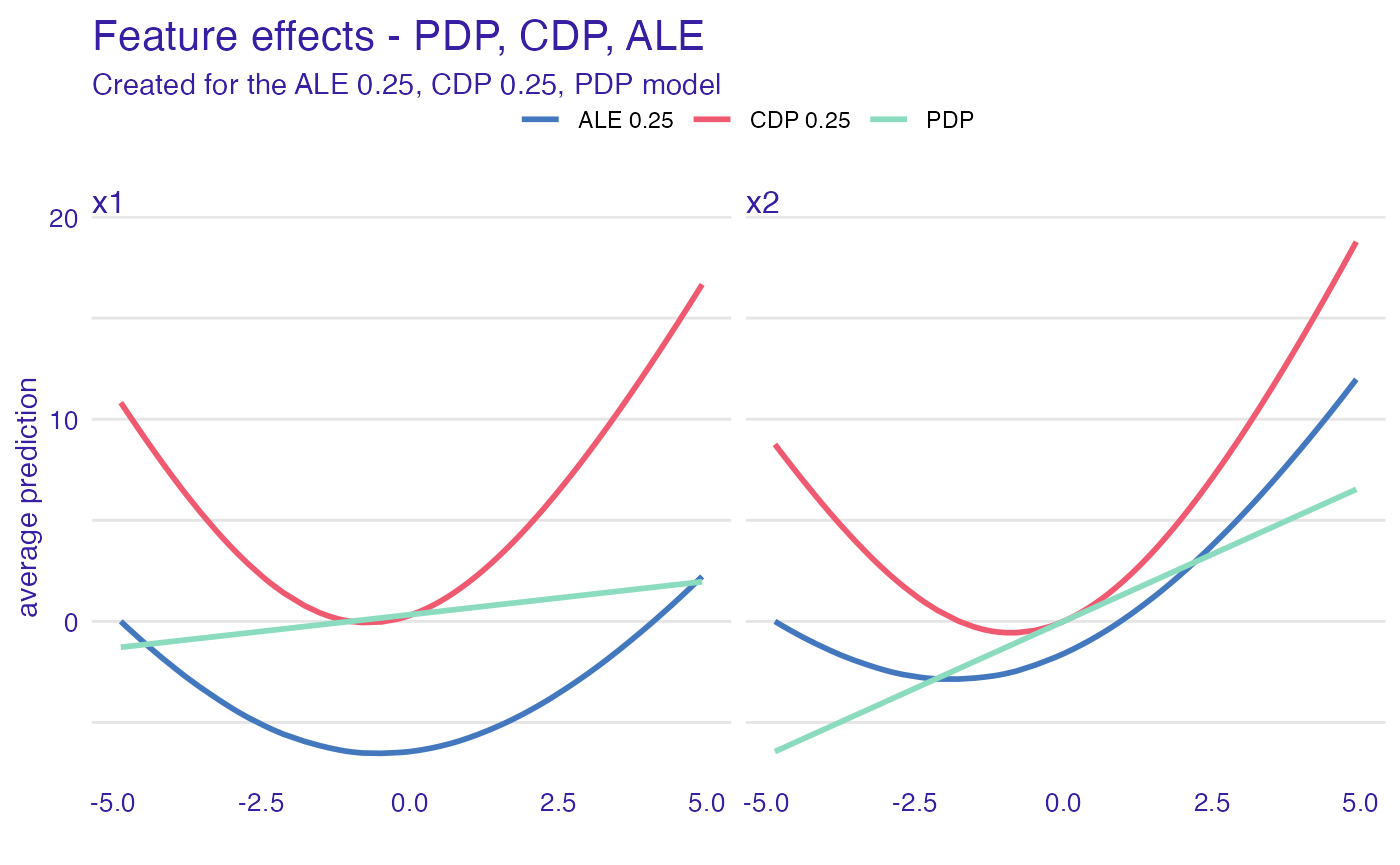
cd_model_1 <- conditional_dependence(explain_the_model, variables = c("x1", "x2"), span = 0.1)
cd_model_1$`_label_` = "CDP 0.1"

cd_model_5 <- conditional_dependence(explain_the_model, variables = c("x1", "x2"), span = 0.5)
cd_model_5$`_label_` = "CDP 0.5"

ad_model_1 <- accumulated_dependence(explain_the_model, variables = c("x1", "x2"), span = 0.5)
ad_model_1$`_label_` = "ALE 0.1"

ad_model_5 <- accumulated_dependence(explain_the_model, variables = c("x1", "x2"), span = 0.5)
ad_model_5$`_label_` = "ALE 0.5"

plot(ad_model, cd_model, pd_model, cd_model_1, cd_model_5, ad_model_1, ad_model_5) +
  ggtitle("Feature effects - PDP, CDP, ALE")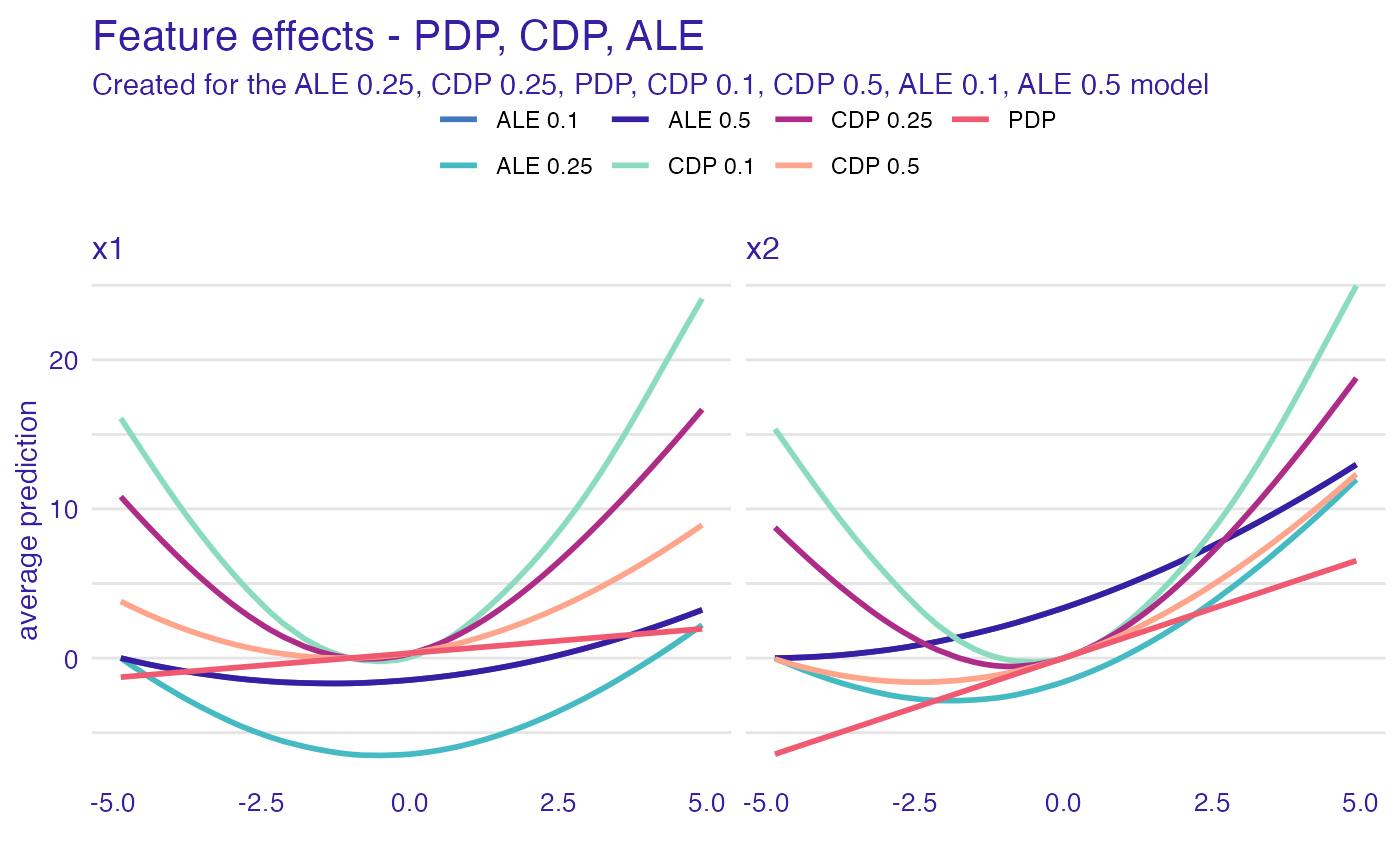
Dependence profiles in groups
And now, let’s see how the grouping factor works
# add grouping variable
df$x3 <- factor(sign(df$x2))
# update the data argument
explain_the_model$data = df

# PDP in groups
pd_model_groups <- partial_dependence(explain_the_model,
                                      variables = c("x1", "x2"),
                                      groups = "x3")
plot(pd_model_groups) +
  ggtitle("Partial Dependence")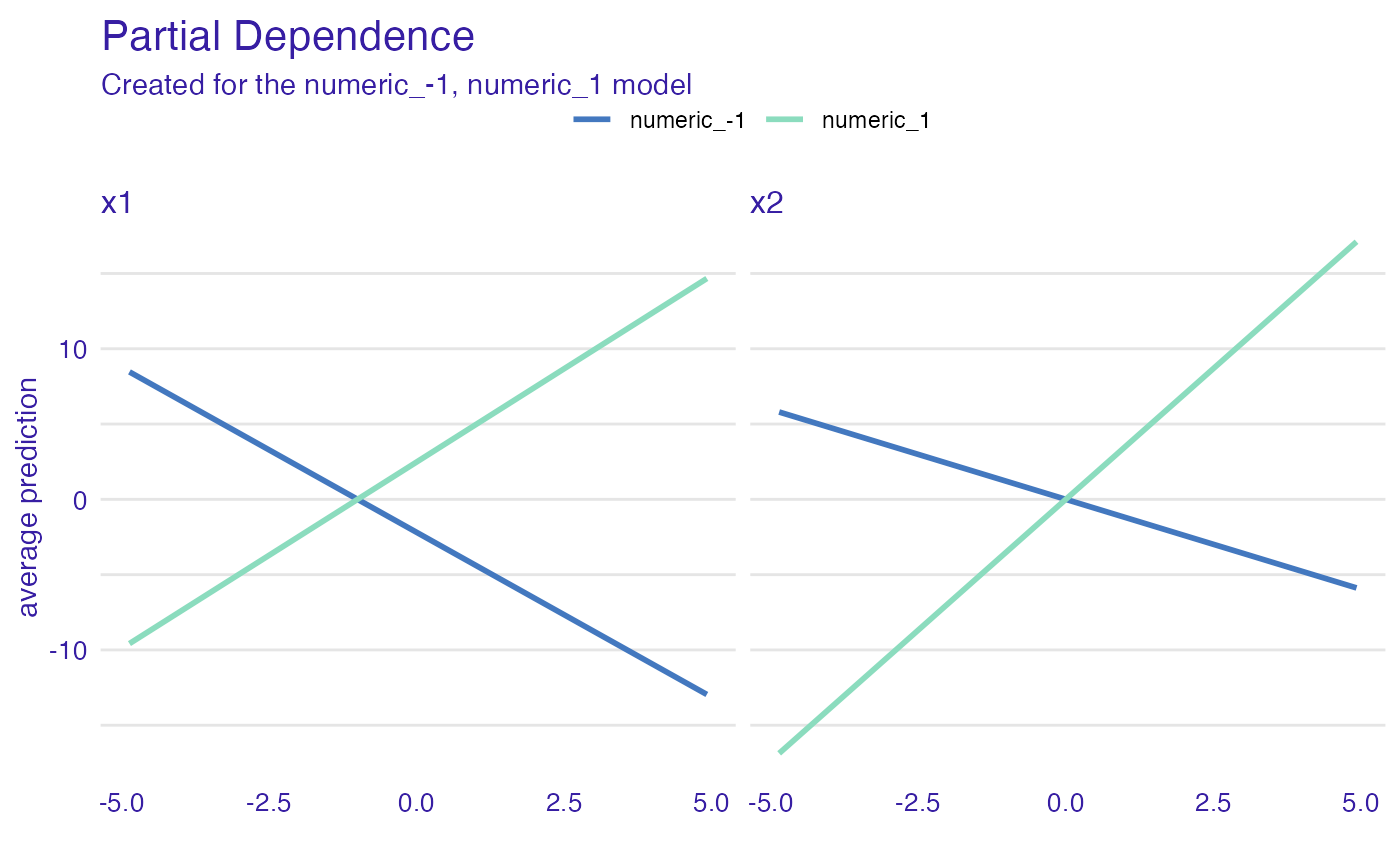
# ALE in groups
ad_model_groups <- accumulated_dependence(explain_the_model,
                                      variables = c("x1", "x2"),
                                      groups = "x3")
plot(ad_model_groups) +
  ggtitle("Accumulated Local")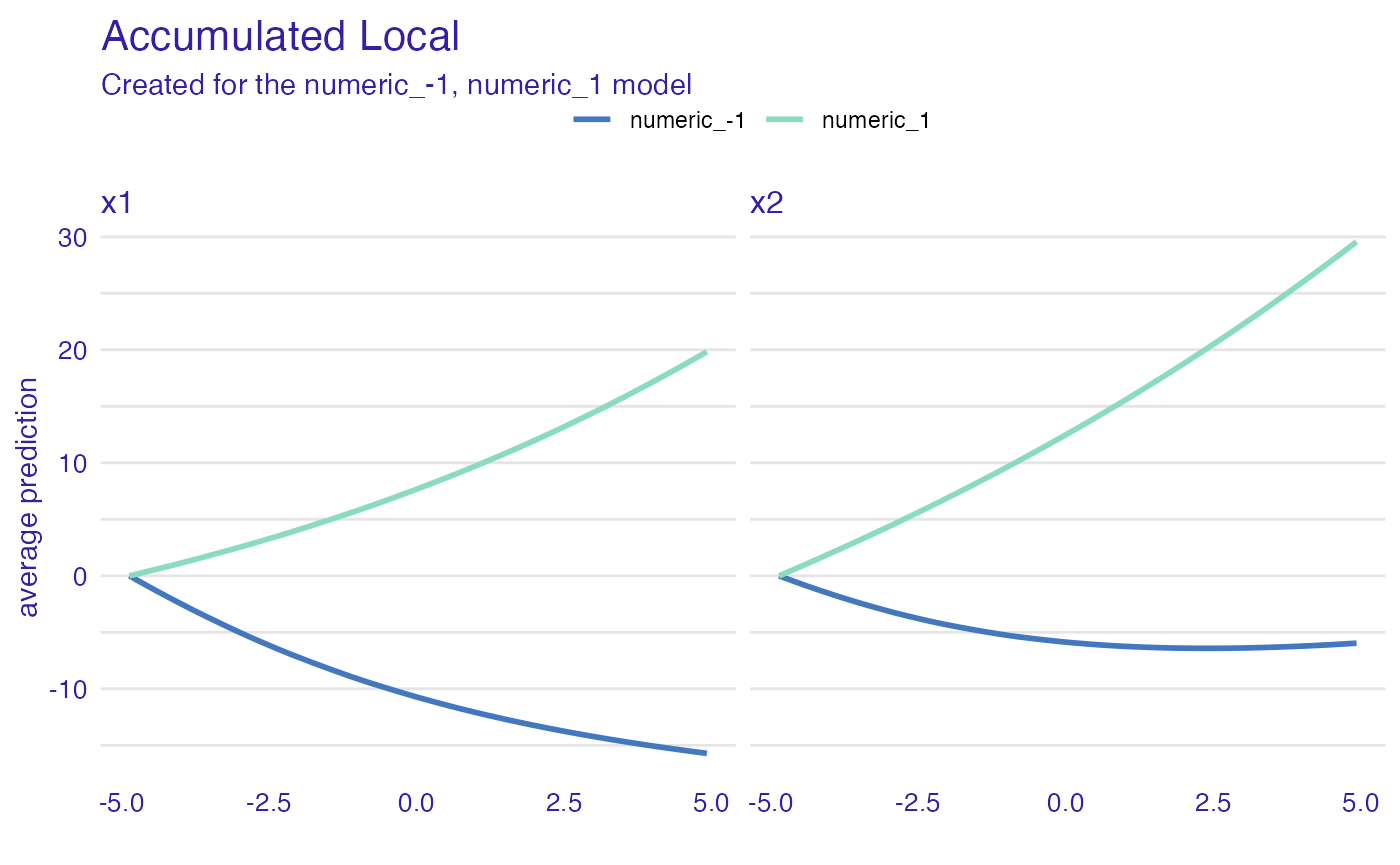
# CDP in groups
cd_model_groups <- conditional_dependence(explain_the_model,
                                      variables = c("x1", "x2"),
                                      groups = "x3")
plot(cd_model_groups) +
  ggtitle("Conditional Dependence")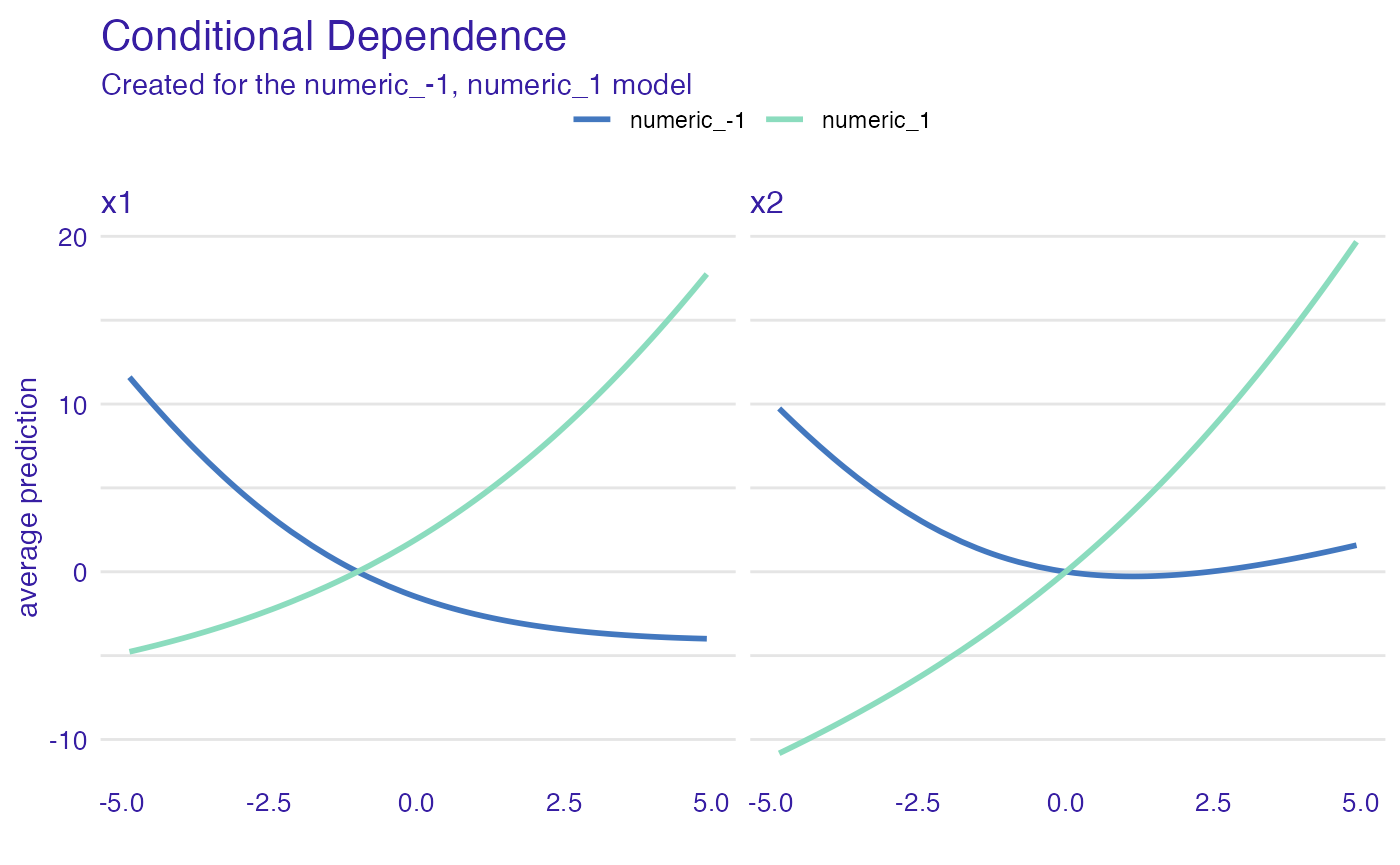
Session info
#> R version 4.2.2 (2022-10-31)
#> Platform: x86_64-apple-darwin17.0 (64-bit)
#> Running under: macOS Big Sur ... 10.16
#>
#> Matrix products: default
#> BLAS:   /Library/Frameworks/R.framework/Versions/4.2/Resources/lib/libRblas.0.dylib
#> LAPACK: /Library/Frameworks/R.framework/Versions/4.2/Resources/lib/libRlapack.dylib
#>
#> locale:
#> [1] en_US.UTF-8/en_US.UTF-8/en_US.UTF-8/C/en_US.UTF-8/en_US.UTF-8
#>
#> attached base packages:
#> [1] stats     graphics  grDevices utils     datasets  methods   base
#>
#> other attached packages:
#> [1] ggplot2_3.4.0     ingredients_2.3.0 DALEX_2.4.2
#>
#> loaded via a namespace (and not attached):
#>  [1] highr_0.10        bslib_0.4.2       compiler_4.2.2    pillar_1.8.1
#>  [5] jquerylib_0.1.4   tools_4.2.2       digest_0.6.31     jsonlite_1.8.4
#>  [9] evaluate_0.19     memoise_2.0.1     lifecycle_1.0.3   tibble_3.1.8
#> [13] gtable_0.3.1      pkgconfig_2.0.3   rlang_1.0.6       cli_3.6.0
#> [17] yaml_2.3.6        pkgdown_2.0.7     xfun_0.36         fastmap_1.1.0
#> [21] withr_2.5.0       stringr_1.5.0     knitr_1.41        desc_1.4.2
#> [25] fs_1.5.2          vctrs_0.5.1       sass_0.4.4        systemfonts_1.0.4
#> [29] rprojroot_2.0.3   grid_4.2.2        glue_1.6.2        R6_2.5.1
#> [33] textshaping_0.3.6 fansi_1.0.3       rmarkdown_2.19    farver_2.1.1
#> [37] purrr_1.0.1       magrittr_2.0.3    scales_1.2.1      htmltools_0.5.4
#> [41] colorspace_2.0-3  labeling_0.4.2    ragg_1.2.5        utf8_1.2.2
#> [45] stringi_1.7.12    munsell_0.5.0     cachem_1.0.6