Partial Dependence Profiles are averages from Ceteris Paribus Profiles.
Function partial_dependence calls ceteris_paribus and then aggregate_profiles.
partial_dependence(x, ...)

# S3 method for explainer
partial_dependence(
  x,
  variables = NULL,
  N = 500,
  variable_splits = NULL,
  grid_points = 101,
  ...,
  variable_type = "numerical"
)

# S3 method for default
partial_dependence(
  x,
  data,
  predict_function = predict,
  label = class(x)[1],
  variables = NULL,
  grid_points = 101,
  variable_splits = NULL,
  N = 500,
  ...,
  variable_type = "numerical"
)

# S3 method for ceteris_paribus_explainer
partial_dependence(x, ..., variables = NULL)

partial_dependency(x, ...)
Arguments
- x
an explainer created with function
DALEX::explain(), an object of the classceteris_paribus_explaineror or a model to be explained.- ...
other parameters
- variables
names of variables for which profiles shall be calculated. Will be passed to
calculate_variable_split. IfNULLthen all variables from the validation data will be used.- N
number of observations used for calculation of partial dependence profiles. By default
500.- variable_splits
named list of splits for variables, in most cases created with
calculate_variable_split. IfNULLthen it will be calculated based on validation data avaliable in theexplainer.- grid_points
number of points for profile. Will be passed to
calculate_variable_split.- variable_type
a character. If
"numerical"then only numerical variables will be calculated. If"categorical"then only categorical variables will be calculated.- data
validation dataset, will be extracted from
xif it's an explainer NOTE: It is best when target variable is not present in thedata- predict_function
predict function, will be extracted from
xif it's an explainer- label
name of the model. By default it's extracted from the
classattribute of the model
Value
an object of the class aggregated_profiles_explainer
Details
Find more details in the Partial Dependence Profiles Chapter.
References
Explanatory Model Analysis. Explore, Explain, and Examine Predictive Models. https://ema.drwhy.ai/
Examples
library("DALEX")
model_titanic_glm <- glm(survived ~ gender + age + fare,
data = titanic_imputed, family = "binomial")
explain_titanic_glm <- explain(model_titanic_glm,
data = titanic_imputed[,-8],
y = titanic_imputed[,8],
verbose = FALSE)
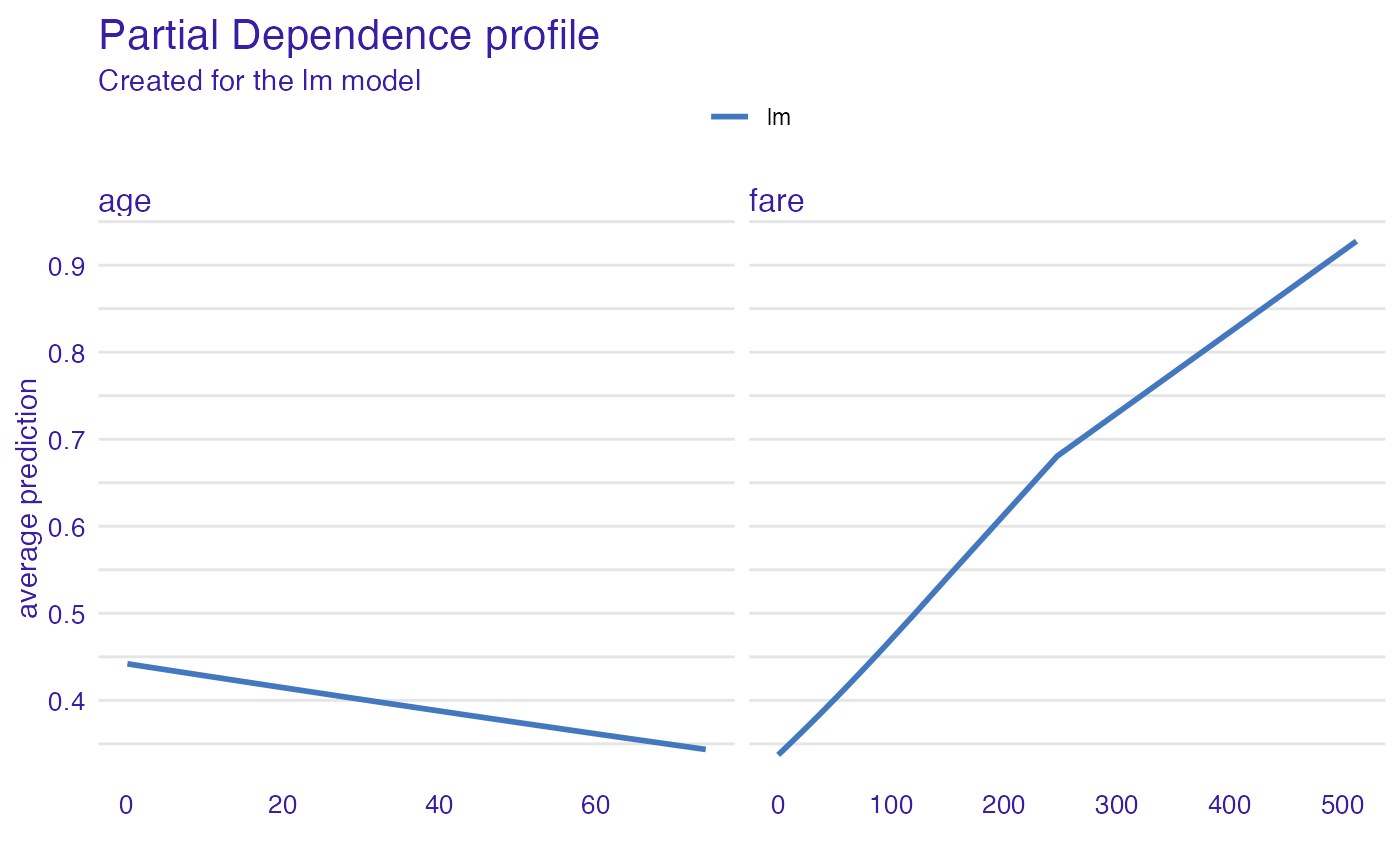
pdp_glm <- partial_dependence(explain_titanic_glm,
N = 25, variables = c("age", "fare"))
head(pdp_glm)
#> Top profiles :
#> _vname_ _label_ _x_ _yhat_ _ids_
#> 1 fare lm 0.0000000 0.3373059 0
#> 2 age lm 0.1666667 0.4419618 0
#> 3 age lm 2.0000000 0.4394139 0
#> 4 age lm 4.0000000 0.4366398 0
#> 5 fare lm 6.1793080 0.3449402 0
#> 6 age lm 7.0000000 0.4324893 0
plot(pdp_glm)
 # \donttest{
library("ranger")
model_titanic_rf <- ranger(survived ~., data = titanic_imputed, probability = TRUE)
explain_titanic_rf <- explain(model_titanic_rf,
data = titanic_imputed[,-8],
y = titanic_imputed[,8],
label = "ranger forest",
verbose = FALSE)
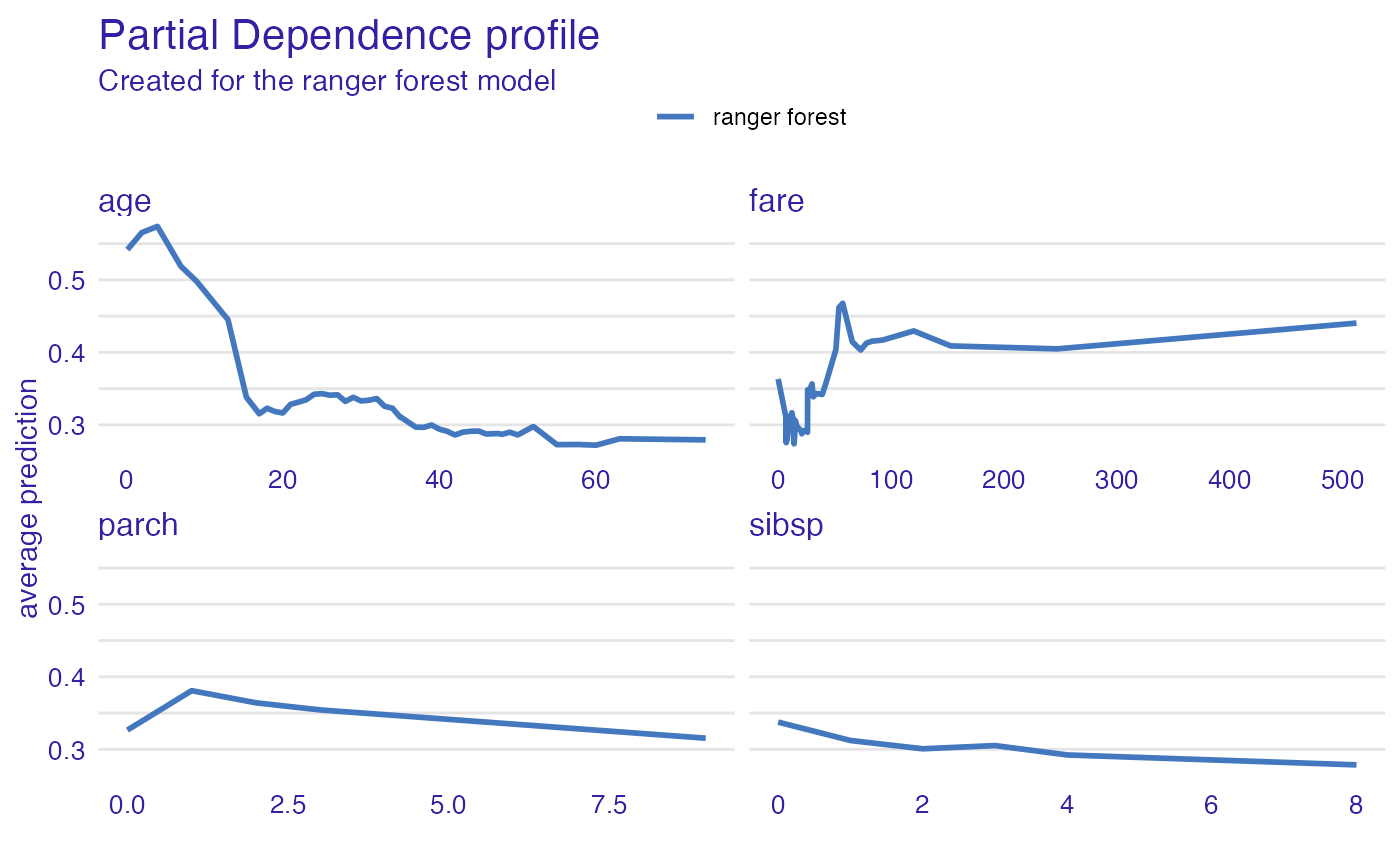
pdp_rf <- partial_dependence(explain_titanic_rf, variable_type = "numerical")
plot(pdp_rf)
# \donttest{
library("ranger")
model_titanic_rf <- ranger(survived ~., data = titanic_imputed, probability = TRUE)
explain_titanic_rf <- explain(model_titanic_rf,
data = titanic_imputed[,-8],
y = titanic_imputed[,8],
label = "ranger forest",
verbose = FALSE)
pdp_rf <- partial_dependence(explain_titanic_rf, variable_type = "numerical")
plot(pdp_rf)
 pdp_rf <- partial_dependence(explain_titanic_rf, variable_type = "categorical")
plotD3(pdp_rf, label_margin = 80, scale_plot = TRUE)
# }
pdp_rf <- partial_dependence(explain_titanic_rf, variable_type = "categorical")
plotD3(pdp_rf, label_margin = 80, scale_plot = TRUE)
# }