Print Dataset Level Model Performance Summary
Source:R/print_model_performance.R
print.model_performance.RdPrint Dataset Level Model Performance Summary
# S3 method for model_performance
print(x, ...)
Arguments
- x
a model to be explained, object of the class 'model_performance_explainer'
- ...
other parameters
Examples
# \donttest{
library("ranger")
titanic_ranger_model <- ranger(survived~., data = titanic_imputed, num.trees = 100,
probability = TRUE)
# It's a good practice to pass data without target variable
explainer_ranger <- explain(titanic_ranger_model, data = titanic_imputed[,-8],
y = titanic_imputed$survived)
#> Preparation of a new explainer is initiated
#> -> model label : ranger ( default )
#> -> data : 2207 rows 7 cols
#> -> target variable : 2207 values
#> -> predict function : yhat.ranger will be used ( default )
#> -> predicted values : No value for predict function target column. ( default )
#> -> model_info : package ranger , ver. 0.14.1 , task classification ( default )
#> -> predicted values : numerical, min = 0.008182132 , mean = 0.3222051 , max = 0.9901092
#> -> residual function : difference between y and yhat ( default )
#> -> residuals : numerical, min = -0.7894434 , mean = -4.831517e-05 , max = 0.8808497
#> A new explainer has been created!
# resulting dataframe has predicted values and residuals
mp_ex_rn <- model_performance(explainer_ranger)
mp_ex_rn
#> Measures for: classification
#> recall : 0.5738397
#> precision : 0.8947368
#> f1 : 0.6992288
#> accuracy : 0.8409606
#> auc : 0.9007602
#>
#> Residuals:
#> 0% 10% 20% 30% 40% 50%
#> -0.78944337 -0.25433067 -0.20607331 -0.18331391 -0.15959006 -0.13094821
#> 60% 70% 80% 90% 100%
#> -0.09476201 0.03200369 0.24348788 0.60113328 0.88084970
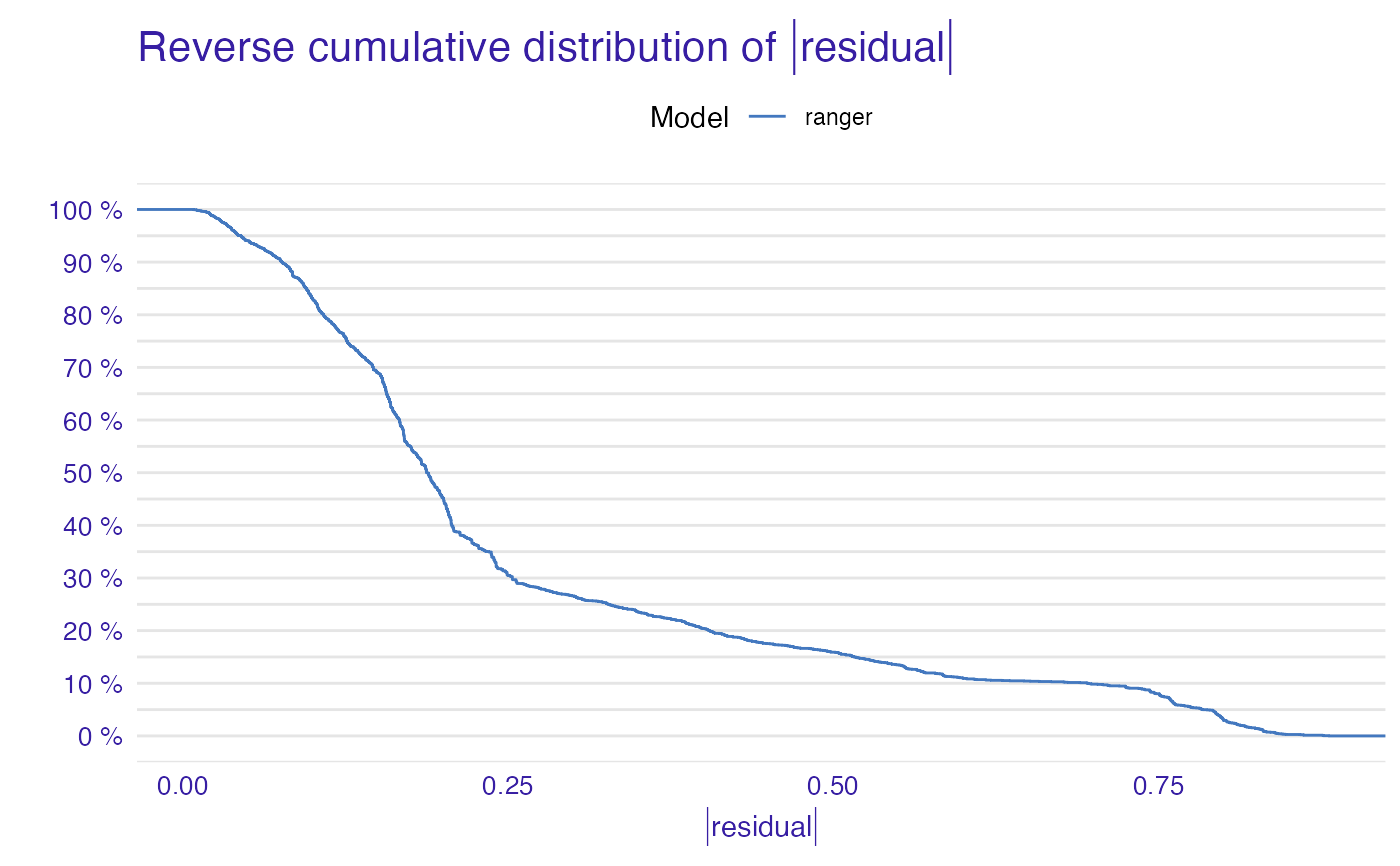
plot(mp_ex_rn)
 # }
# }