Function model_performance() calculates various performance measures for classification and regression models.
For classification models following measures are calculated: F1, accuracy, recall, precision and AUC.
For regression models following measures are calculated: mean squared error, R squared, median absolute deviation.
model_performance(explainer, ..., cutoff = 0.5)Arguments
- explainer
a model to be explained, preprocessed by the
explainfunction- ...
other parameters
- cutoff
a cutoff for classification models, needed for measures like recall, precision, ACC, F1. By default 0.5.
Value
An object of the class model_performance.
It's a list with following fields:
residuals- data frame that contains residuals for each observationmeasures- list with calculated measures that are dedicated for the task, whether it is regression, binary classification or multiclass classification.type- character that specifies type of the task.
References
Explanatory Model Analysis. Explore, Explain, and Examine Predictive Models. https://ema.drwhy.ai/
Examples
# \donttest{
# regression
library("ranger")
apartments_ranger_model <- ranger(m2.price~., data = apartments, num.trees = 50)
explainer_ranger_apartments <- explain(apartments_ranger_model, data = apartments[,-1],
y = apartments$m2.price, label = "Ranger Apartments")
#> Preparation of a new explainer is initiated
#> -> model label : Ranger Apartments
#> -> data : 1000 rows 5 cols
#> -> target variable : 1000 values
#> -> predict function : yhat.ranger will be used ( default )
#> -> predicted values : No value for predict function target column. ( default )
#> -> model_info : package ranger , ver. 0.14.1 , task regression ( default )
#> -> predicted values : numerical, min = 1869.304 , mean = 3488.634 , max = 6164.522
#> -> residual function : difference between y and yhat ( default )
#> -> residuals : numerical, min = -415.6353 , mean = -1.614668 , max = 649.3253
#> A new explainer has been created!
model_performance_ranger_aps <- model_performance(explainer_ranger_apartments )
model_performance_ranger_aps
#> Measures for: regression
#> mse : 24901.87
#> rmse : 157.8033
#> r2 : 0.9696787
#> mad : 89.72723
#>
#> Residuals:
#> 0% 10% 20% 30% 40% 50%
#> -415.635333 -166.039673 -115.898733 -81.885100 -56.288733 -28.946381
#> 60% 70% 80% 90% 100%
#> 6.227667 46.894300 104.919600 206.875317 649.325333
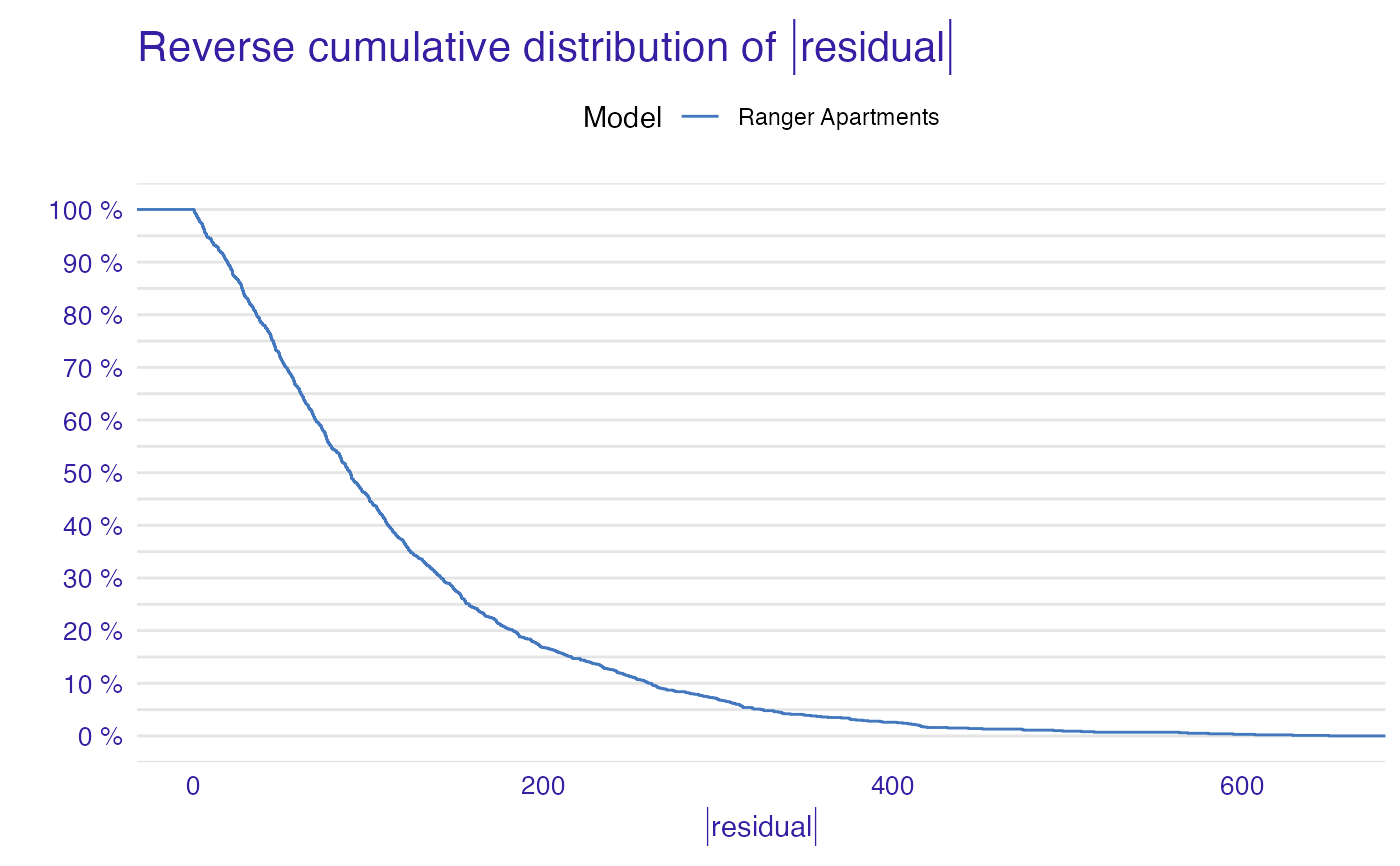
plot(model_performance_ranger_aps)
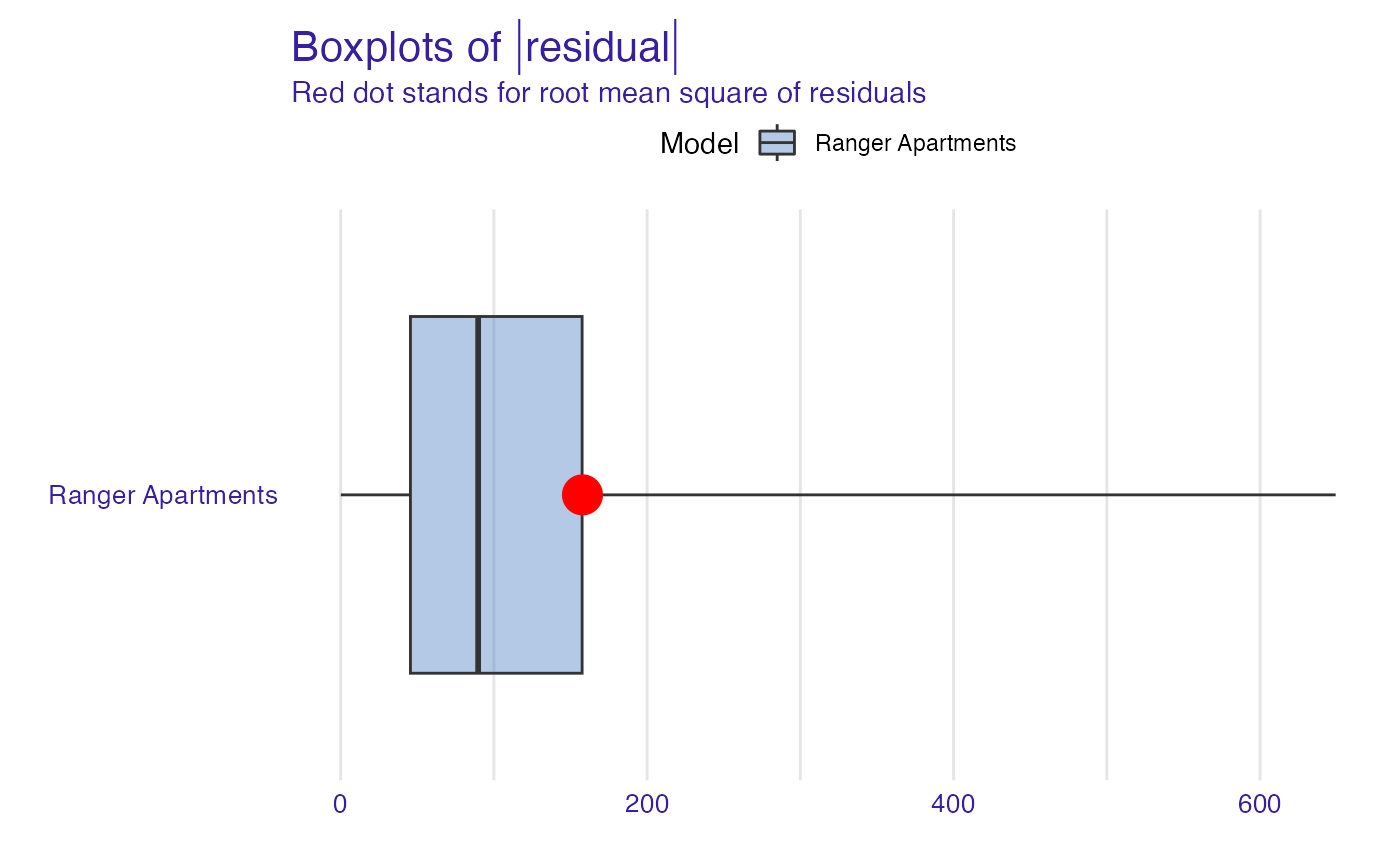
 plot(model_performance_ranger_aps, geom = "boxplot")
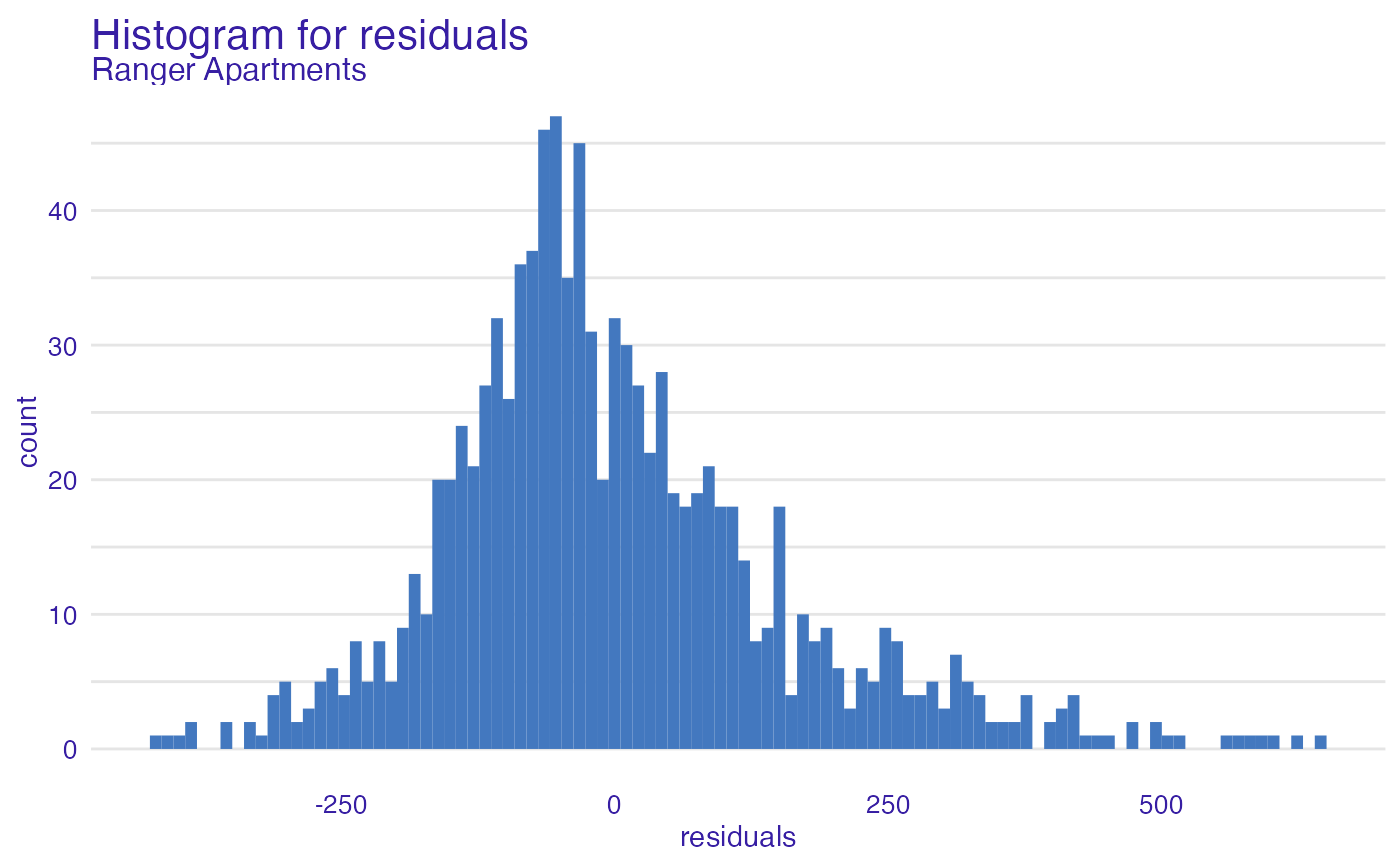
 plot(model_performance_ranger_aps, geom = "histogram")
 # binary classification
titanic_glm_model <- glm(survived~., data = titanic_imputed, family = "binomial")
explainer_glm_titanic <- explain(titanic_glm_model, data = titanic_imputed[,-8],
y = titanic_imputed$survived)
#> Preparation of a new explainer is initiated
#> -> model label : lm ( default )
#> -> data : 2207 rows 7 cols
#> -> target variable : 2207 values
#> -> predict function : yhat.glm will be used ( default )
#> -> predicted values : No value for predict function target column. ( default )
#> -> model_info : package stats , ver. 4.2.3 , task classification ( default )
#> -> predicted values : numerical, min = 0.008128381 , mean = 0.3221568 , max = 0.9731431
#> -> residual function : difference between y and yhat ( default )
#> -> residuals : numerical, min = -0.9628583 , mean = -2.569729e-10 , max = 0.9663346
#> A new explainer has been created!
model_performance_glm_titanic <- model_performance(explainer_glm_titanic)
model_performance_glm_titanic
#> Measures for: classification
#> recall : 0.5738397
#> precision : 0.7472527
#> f1 : 0.6491647
#> accuracy : 0.8001812
#> auc : 0.8115462
#>
#> Residuals:
#> 0% 10% 20% 30% 40% 50%
#> -0.96285832 -0.32240247 -0.23986439 -0.19544185 -0.14842925 -0.11460334
#> 60% 70% 80% 90% 100%
#> -0.06940964 0.06185475 0.29607060 0.72120412 0.96633458
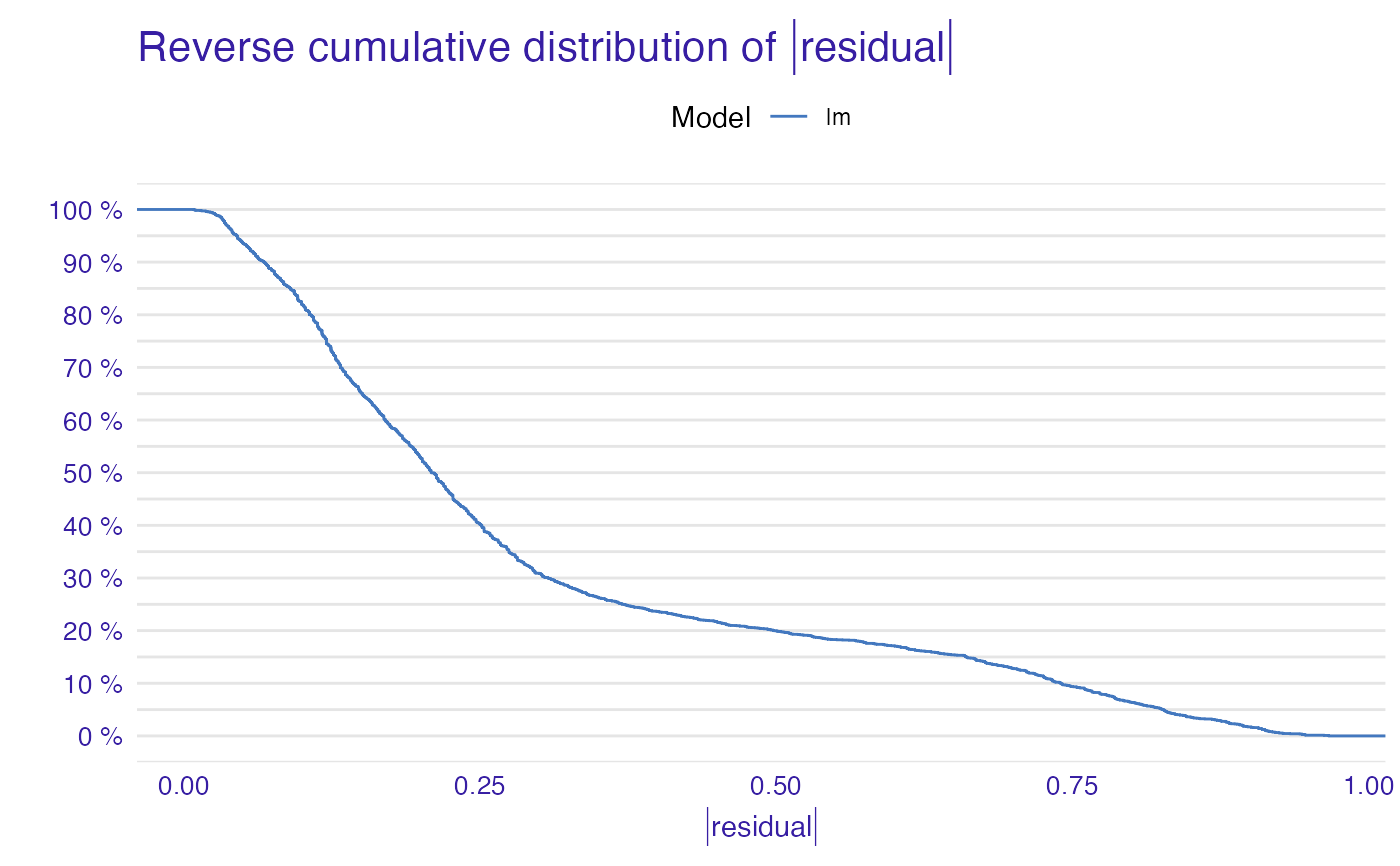
plot(model_performance_glm_titanic)
# binary classification
titanic_glm_model <- glm(survived~., data = titanic_imputed, family = "binomial")
explainer_glm_titanic <- explain(titanic_glm_model, data = titanic_imputed[,-8],
y = titanic_imputed$survived)
#> Preparation of a new explainer is initiated
#> -> model label : lm ( default )
#> -> data : 2207 rows 7 cols
#> -> target variable : 2207 values
#> -> predict function : yhat.glm will be used ( default )
#> -> predicted values : No value for predict function target column. ( default )
#> -> model_info : package stats , ver. 4.2.3 , task classification ( default )
#> -> predicted values : numerical, min = 0.008128381 , mean = 0.3221568 , max = 0.9731431
#> -> residual function : difference between y and yhat ( default )
#> -> residuals : numerical, min = -0.9628583 , mean = -2.569729e-10 , max = 0.9663346
#> A new explainer has been created!
model_performance_glm_titanic <- model_performance(explainer_glm_titanic)
model_performance_glm_titanic
#> Measures for: classification
#> recall : 0.5738397
#> precision : 0.7472527
#> f1 : 0.6491647
#> accuracy : 0.8001812
#> auc : 0.8115462
#>
#> Residuals:
#> 0% 10% 20% 30% 40% 50%
#> -0.96285832 -0.32240247 -0.23986439 -0.19544185 -0.14842925 -0.11460334
#> 60% 70% 80% 90% 100%
#> -0.06940964 0.06185475 0.29607060 0.72120412 0.96633458
plot(model_performance_glm_titanic)
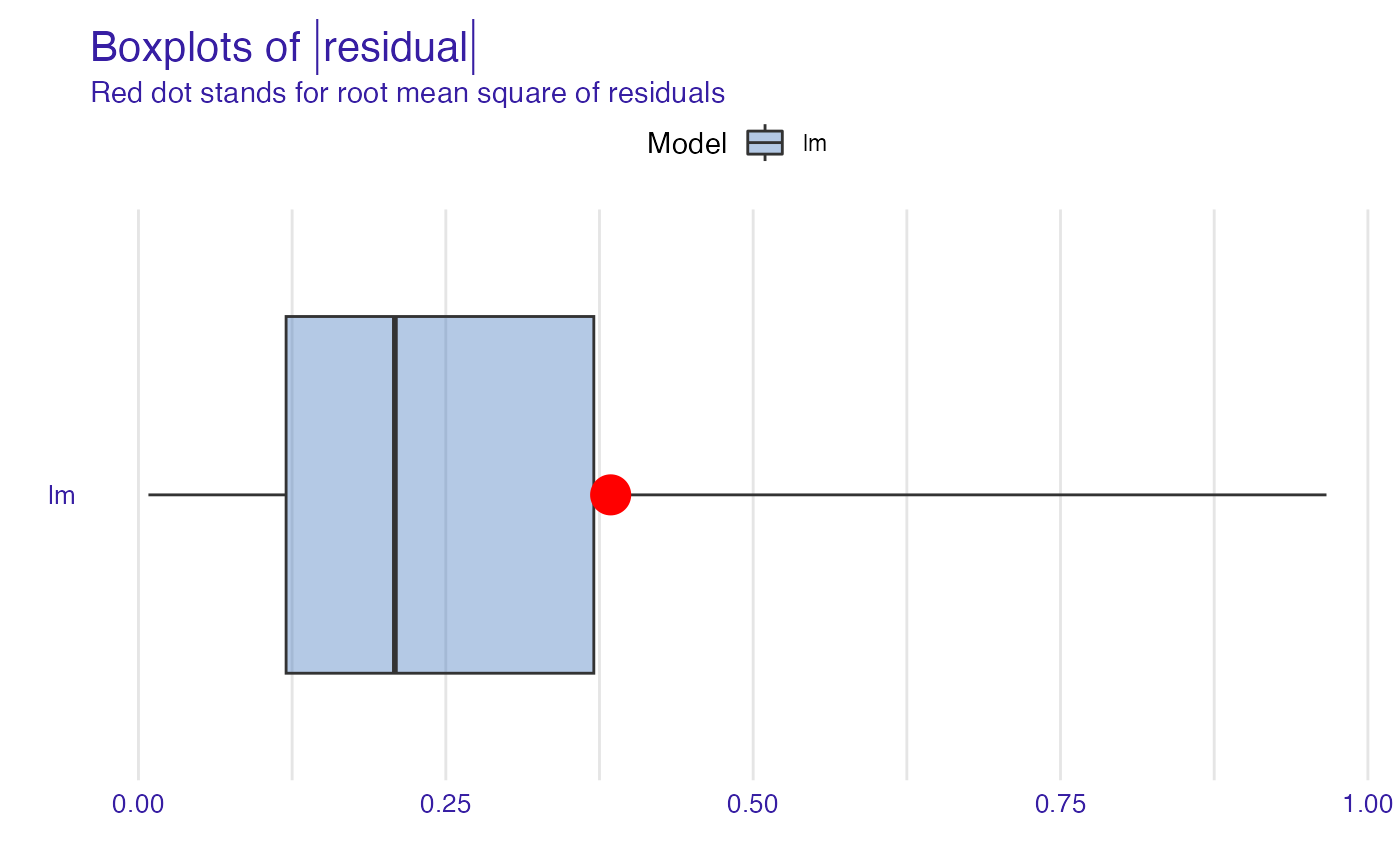
 plot(model_performance_glm_titanic, geom = "boxplot")
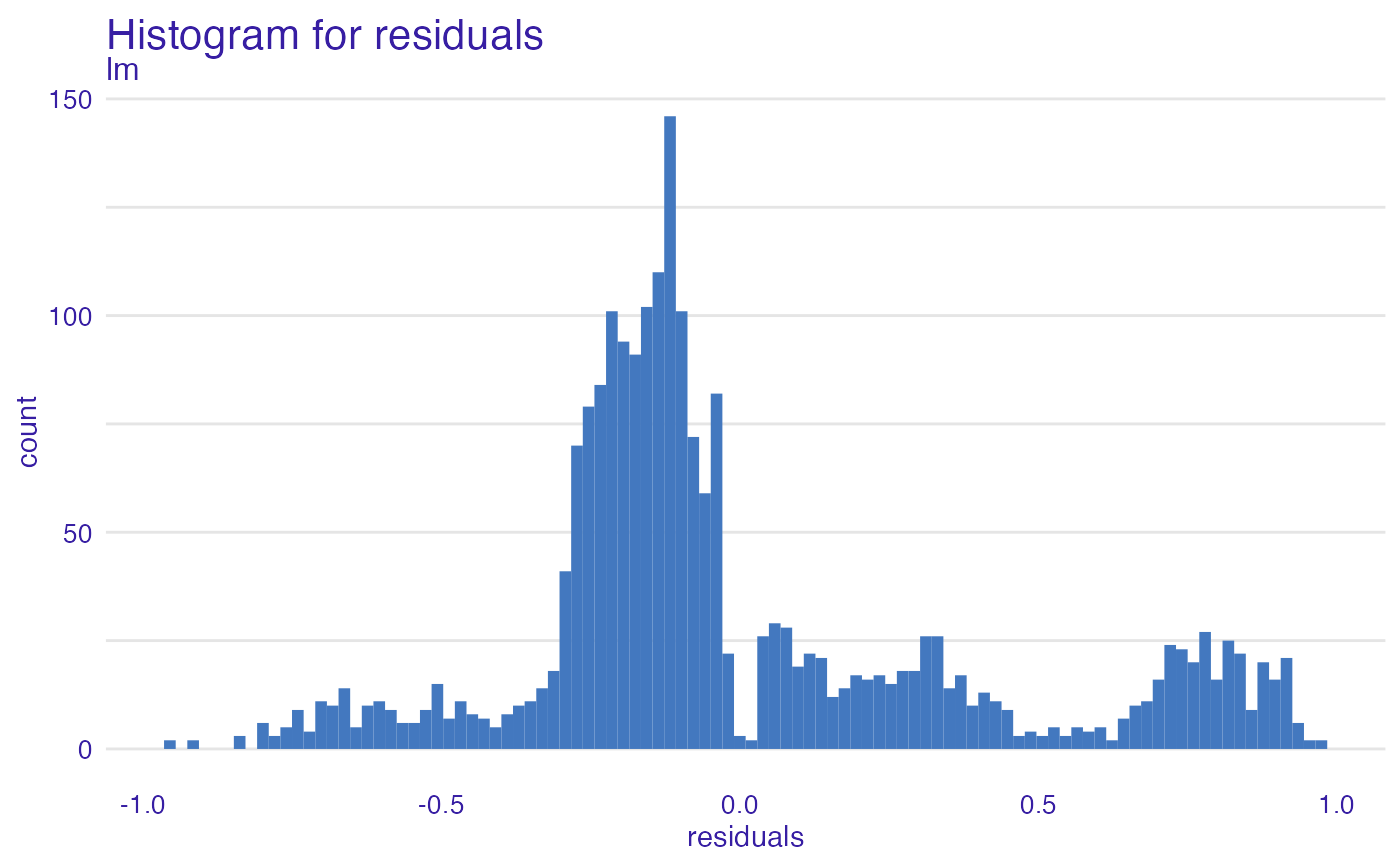
 plot(model_performance_glm_titanic, geom = "histogram")
 # multilabel classification
HR_ranger_model <- ranger(status~., data = HR, num.trees = 50,
probability = TRUE)
explainer_ranger_HR <- explain(HR_ranger_model, data = HR[,-6],
y = HR$status, label = "Ranger HR")
#> Preparation of a new explainer is initiated
#> -> model label : Ranger HR
#> -> data : 7847 rows 5 cols
#> -> target variable : 7847 values
#> -> predict function : yhat.ranger will be used ( default )
#> -> predicted values : No value for predict function target column. ( default )
#> -> model_info : package ranger , ver. 0.14.1 , task multiclass ( default )
#> -> predicted values : predict function returns multiple columns: 3 ( default )
#> -> residual function : difference between 1 and probability of true class ( default )
#> -> residuals : numerical, min = 0 , mean = 0.2774276 , max = 0.8822464
#> A new explainer has been created!
model_performance_ranger_HR <- model_performance(explainer_ranger_HR)
model_performance_ranger_HR
#> Measures for: multiclass
#> micro_F1 : 0.8682299
#> macro_F1 : 0.8665459
#> w_macro_F1 : 0.8672412
#> accuracy : 0.8682299
#> w_macro_auc: 0.9767981
#> cross_entro: 2976.313
#>
#> Residuals:
#> 0% 10% 20% 30% 40% 50% 60%
#> 0.00000000 0.02883482 0.06314101 0.11658845 0.17280386 0.23823724 0.31082295
#> 70% 80% 90% 100%
#> 0.39140746 0.48752605 0.59540191 0.88224638
plot(model_performance_ranger_HR)
# multilabel classification
HR_ranger_model <- ranger(status~., data = HR, num.trees = 50,
probability = TRUE)
explainer_ranger_HR <- explain(HR_ranger_model, data = HR[,-6],
y = HR$status, label = "Ranger HR")
#> Preparation of a new explainer is initiated
#> -> model label : Ranger HR
#> -> data : 7847 rows 5 cols
#> -> target variable : 7847 values
#> -> predict function : yhat.ranger will be used ( default )
#> -> predicted values : No value for predict function target column. ( default )
#> -> model_info : package ranger , ver. 0.14.1 , task multiclass ( default )
#> -> predicted values : predict function returns multiple columns: 3 ( default )
#> -> residual function : difference between 1 and probability of true class ( default )
#> -> residuals : numerical, min = 0 , mean = 0.2774276 , max = 0.8822464
#> A new explainer has been created!
model_performance_ranger_HR <- model_performance(explainer_ranger_HR)
model_performance_ranger_HR
#> Measures for: multiclass
#> micro_F1 : 0.8682299
#> macro_F1 : 0.8665459
#> w_macro_F1 : 0.8672412
#> accuracy : 0.8682299
#> w_macro_auc: 0.9767981
#> cross_entro: 2976.313
#>
#> Residuals:
#> 0% 10% 20% 30% 40% 50% 60%
#> 0.00000000 0.02883482 0.06314101 0.11658845 0.17280386 0.23823724 0.31082295
#> 70% 80% 90% 100%
#> 0.39140746 0.48752605 0.59540191 0.88224638
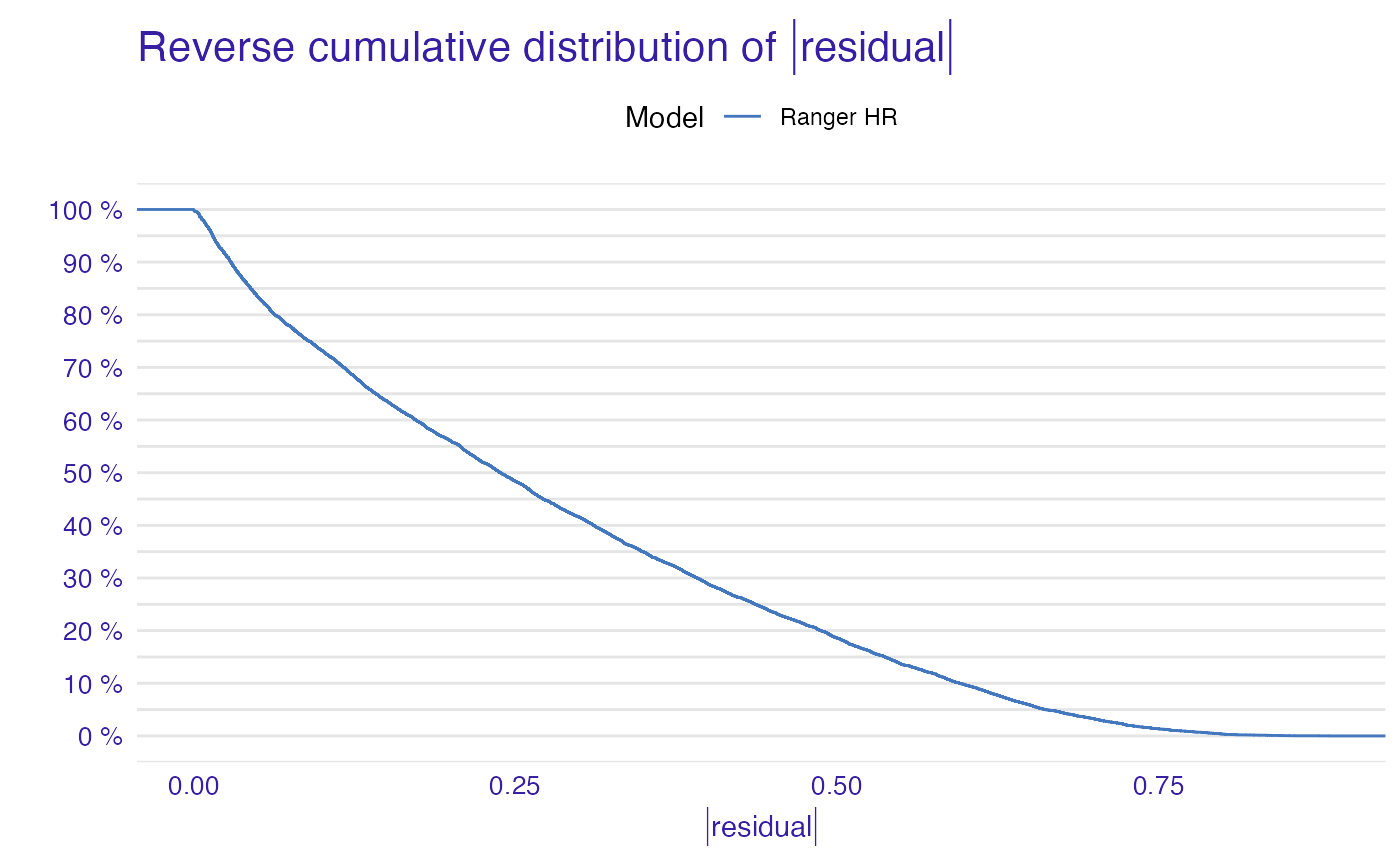
plot(model_performance_ranger_HR)
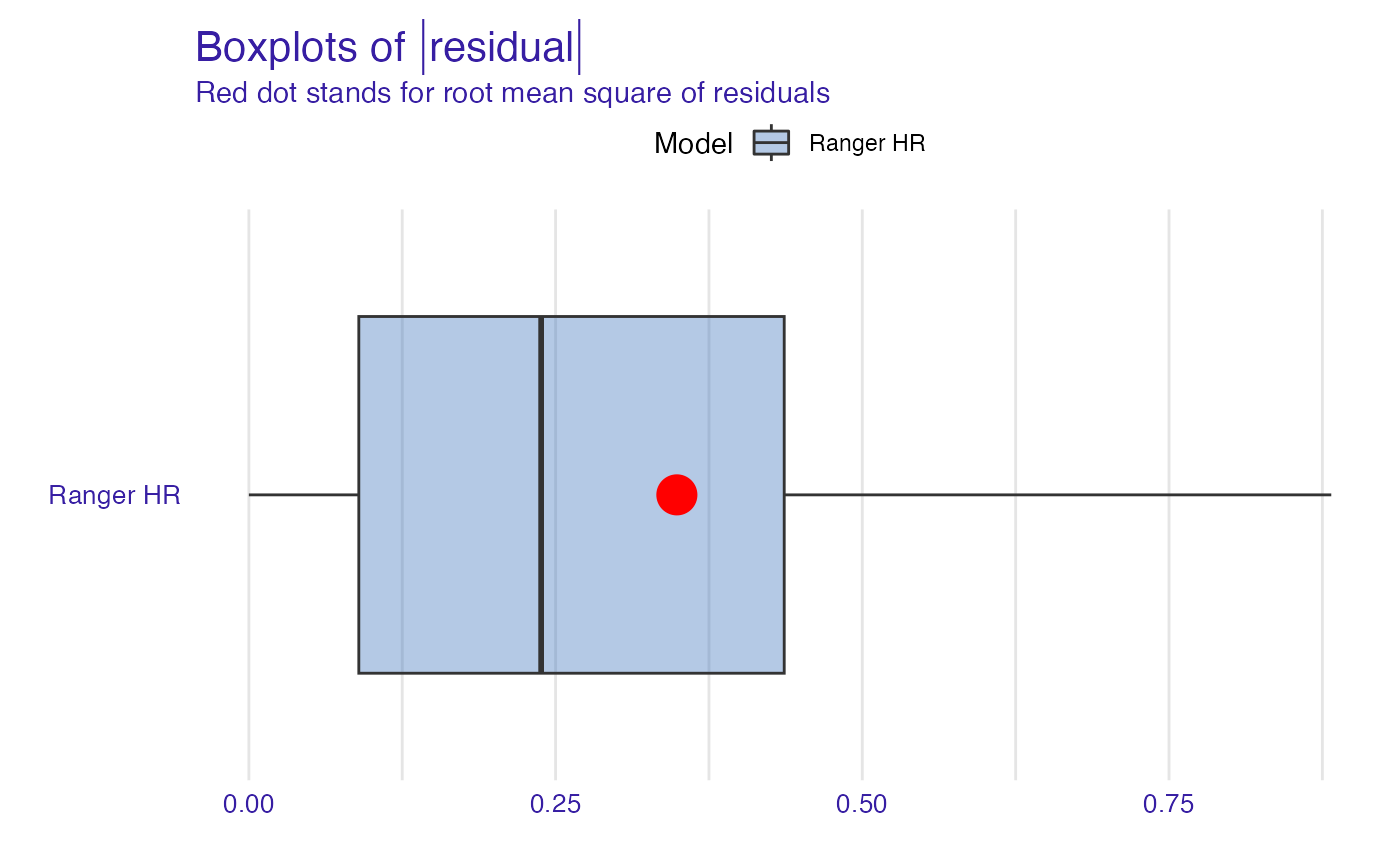
 plot(model_performance_ranger_HR, geom = "boxplot")
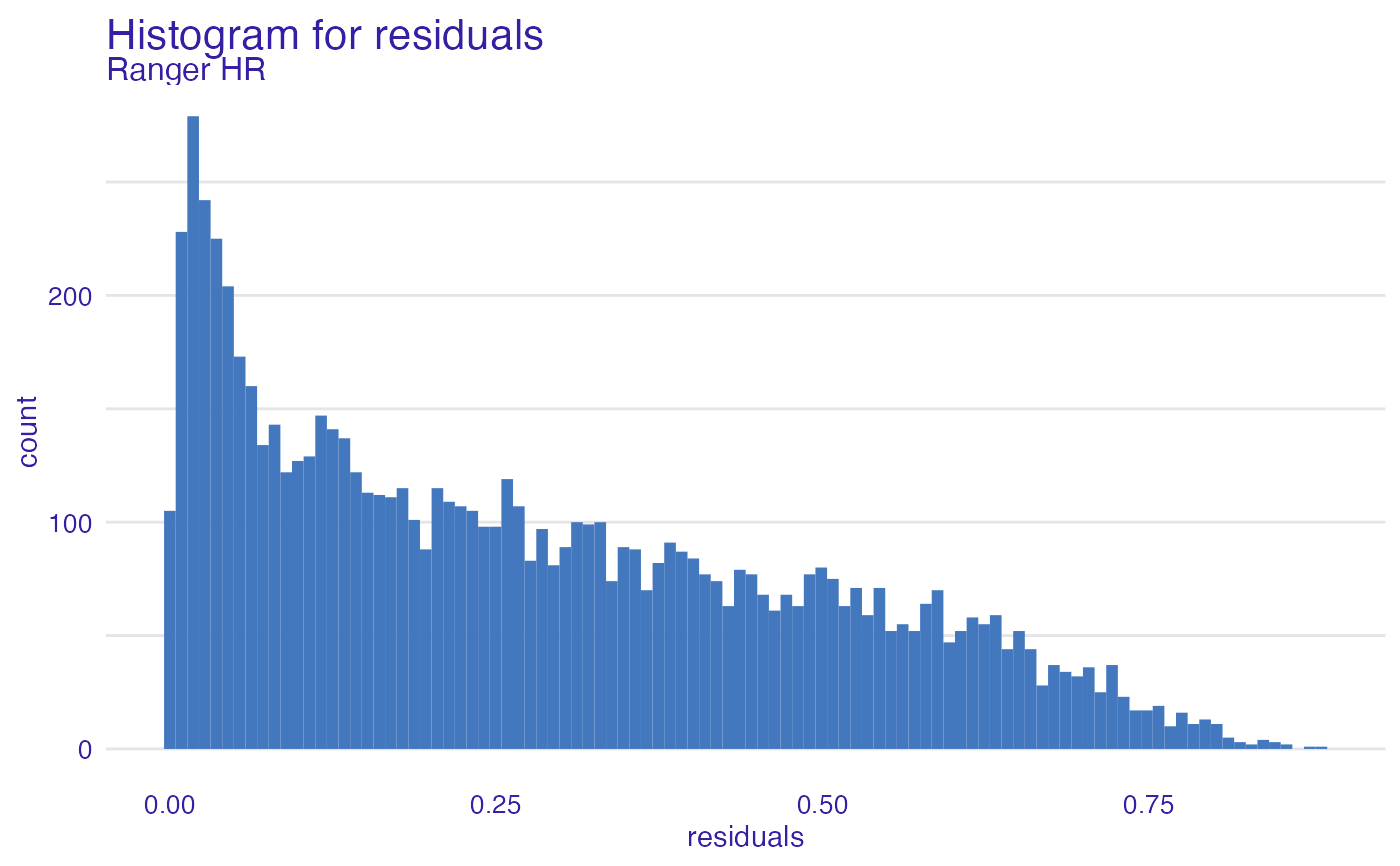
 plot(model_performance_ranger_HR, geom = "histogram")
 # }
# }