Plot Instance Level Residual Diagnostics
Source:R/plot_predict_diagnostics.R
plot.predict_diagnostics.RdPlot Instance Level Residual Diagnostics
# S3 method for predict_diagnostics
plot(x, ...)
Arguments
- x
an object with instance level residual diagnostics created with
predict_diagnosticsfunction- ...
other parameters that will be passed to
plot.ceteris_paribus_explaine.
Value
an ggplot2 object of the class gg.
Examples
# \donttest{
library("ranger")
titanic_glm_model <- ranger(survived ~ gender + age + class + fare + sibsp + parch,
                     data = titanic_imputed)
explainer_glm <- explain(titanic_glm_model,
                         data = titanic_imputed,
                         y = titanic_imputed$survived)
#> Preparation of a new explainer is initiated
#>   -> model label       :  ranger  (  default  )
#>   -> data              :  2207  rows  8  cols
#>   -> target variable   :  2207  values
#>   -> predict function  :  yhat.ranger  will be used (  default  )
#>   -> predicted values  :  No value for predict function target column. (  default  )
#>   -> model_info        :  package ranger , ver. 0.14.1 , task regression (  default  )
#>   -> predicted values  :  numerical, min =  0.009358695 , mean =  0.3226251 , max =  0.9954396
#>   -> residual function :  difference between y and yhat (  default  )
#>   -> residuals         :  numerical, min =  -0.8065088 , mean =  -0.0004683031 , max =  0.8752794
#>   A new explainer has been created!
johny_d <- titanic_imputed[24, c("gender", "age", "class", "fare", "sibsp", "parch")]

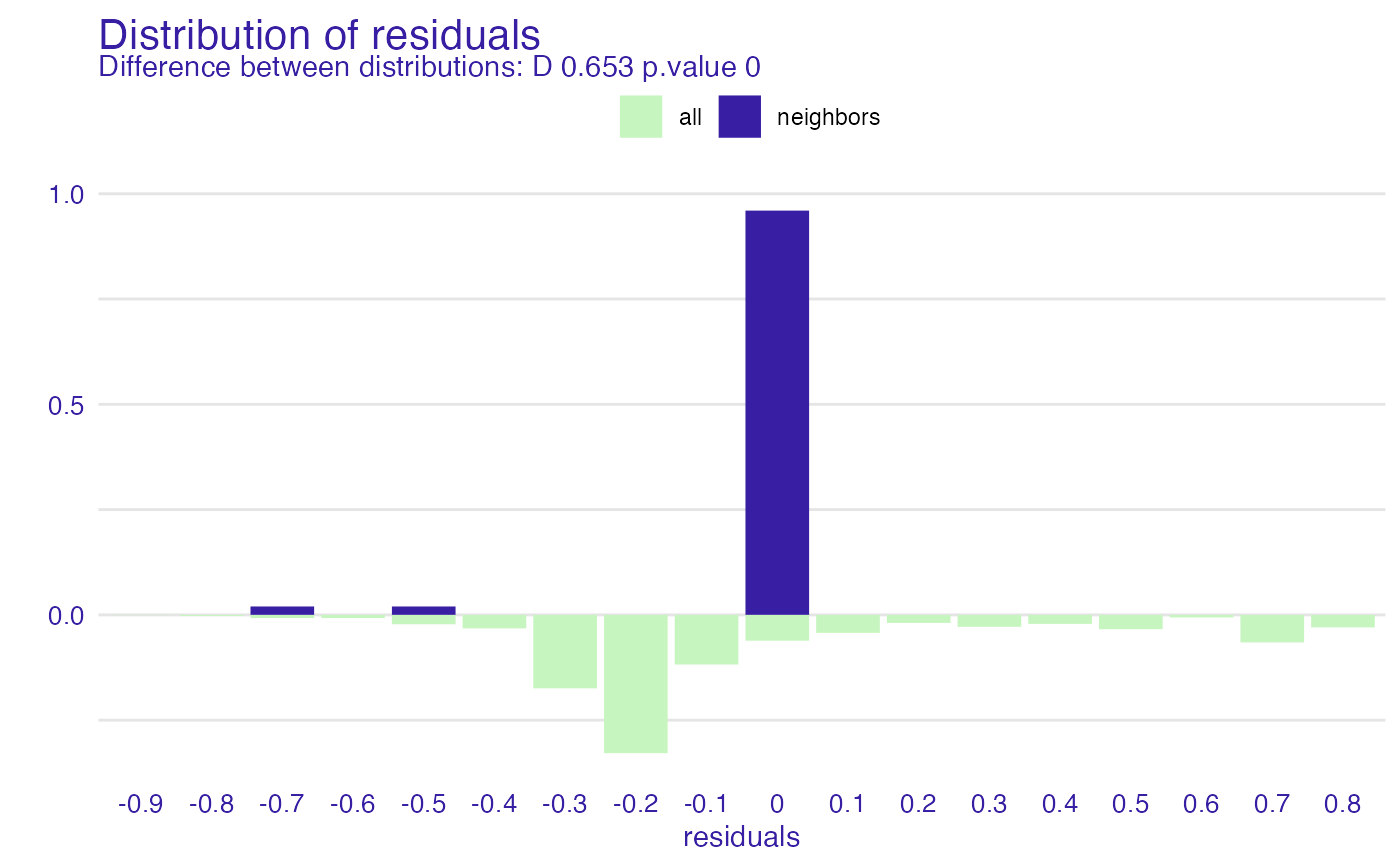
pl <- predict_diagnostics(explainer_glm, johny_d, variables = NULL)
#> Warning: p-value will be approximate in the presence of ties
plot(pl)


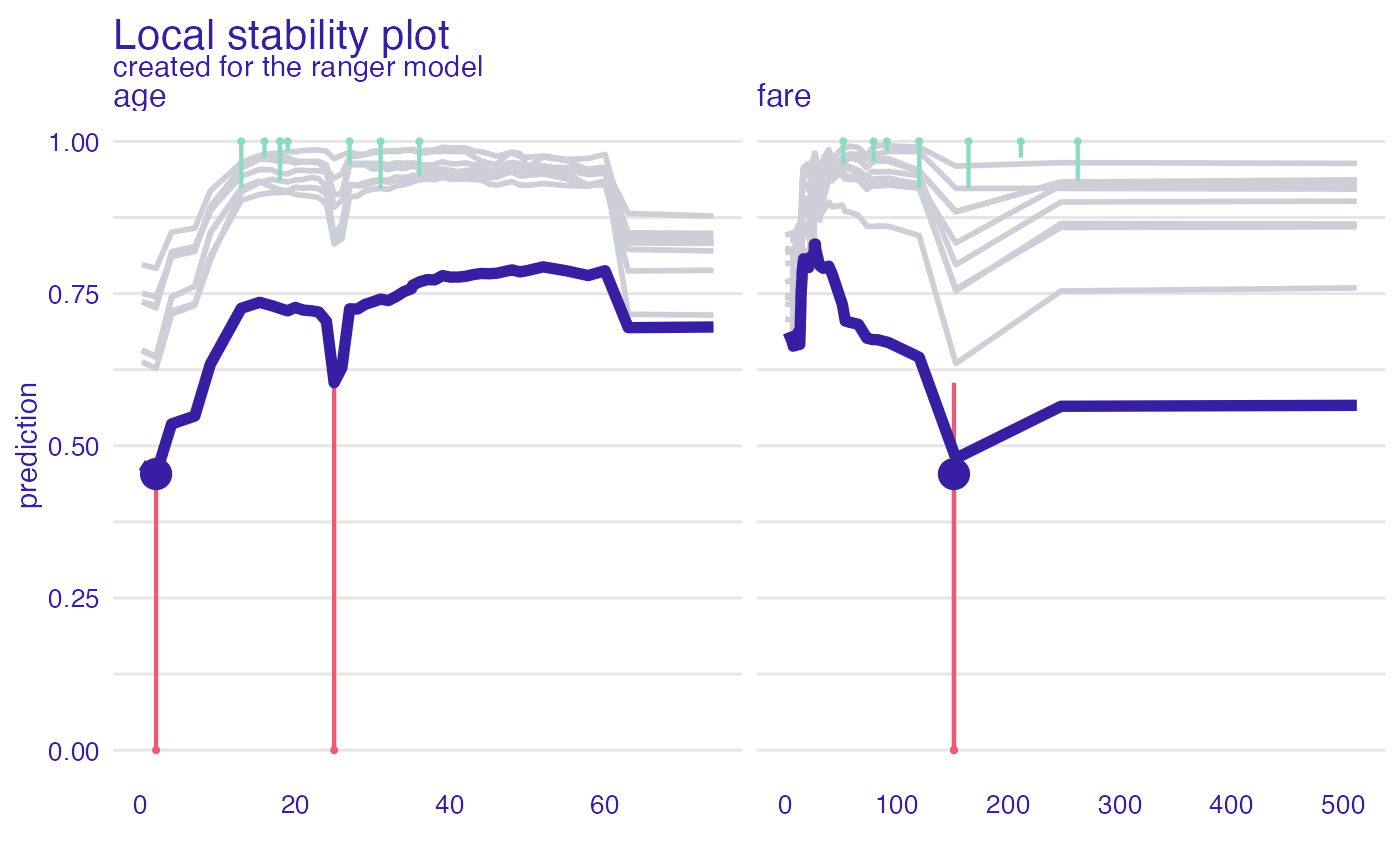
pl <- predict_diagnostics(explainer_glm, johny_d,
                       neighbors = 10,
                       variables = c("age", "fare"))
plot(pl)


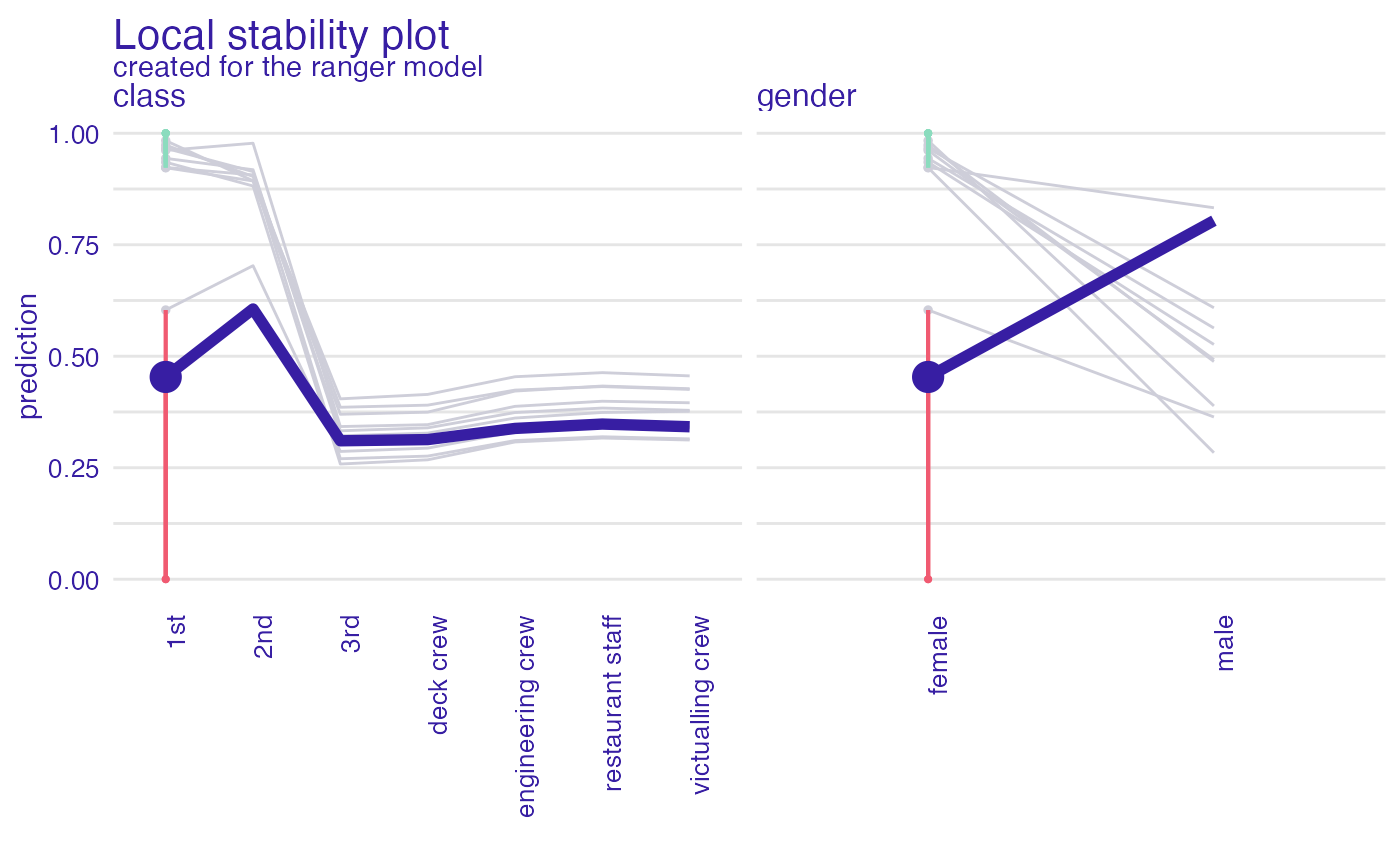
pl <- predict_diagnostics(explainer_glm,
                       johny_d,
                       neighbors = 10,
                       variables = c("class", "gender"))
plot(pl)
#> 'variable_type' changed to 'categorical' due to lack of numerical variables.
#> 'variable_type' changed to 'categorical' due to lack of numerical variables.

# }
# }