Plot Dataset Level Model Profile Explanations
# S3 method for model_profile
plot(x, ..., geom = "aggregates")
Arguments
- x
a variable profile explanation, created with the
model_profilefunction- ...
other parameters
- geom
either
"aggregates","profiles","points"determines which will be plotted
Value
An object of the class ggplot.
aggregates
colora character. Either name of a color, or hex code for a color, or_label_if models shall be colored, or_ids_if instances shall be coloredsizea numeric. Size of lines to be plottedalphaa numeric between0and1. Opacity of linesfacet_ncolnumber of columns for thefacet_wrapvariablesif notNULLthen onlyvariableswill be presentedtitlea character. Partial and accumulated dependence explainers have deafult value.subtitlea character. IfNULLvalue will be dependent on model usage.
Examples
titanic_glm_model <- glm(survived~., data = titanic_imputed, family = "binomial")
explainer_glm <- explain(titanic_glm_model, data = titanic_imputed)
#> Preparation of a new explainer is initiated
#> -> model label : lm ( default )
#> -> data : 2207 rows 8 cols
#> -> target variable : not specified! ( WARNING )
#> -> predict function : yhat.glm will be used ( default )
#> -> predicted values : No value for predict function target column. ( default )
#> -> model_info : package stats , ver. 4.2.3 , task classification ( default )
#> -> model_info : Model info detected classification task but 'y' is a NULL . ( WARNING )
#> -> model_info : By deafult classification tasks supports only numercical 'y' parameter.
#> -> model_info : Consider changing to numerical vector with 0 and 1 values.
#> -> model_info : Otherwise I will not be able to calculate residuals or loss function.
#> -> predicted values : numerical, min = 0.008128381 , mean = 0.3221568 , max = 0.9731431
#> -> residual function : difference between y and yhat ( default )
#> A new explainer has been created!
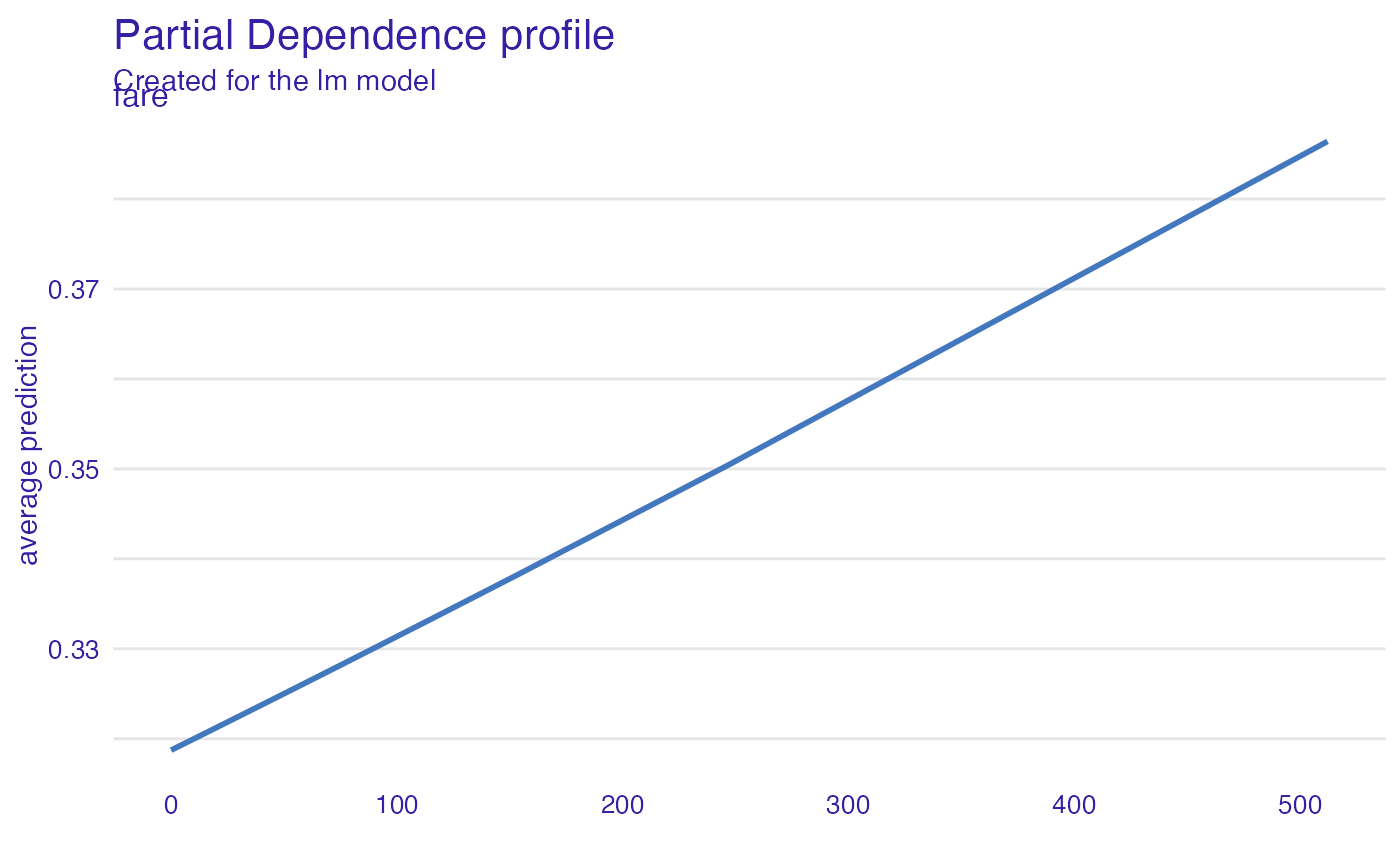
expl_glm <- model_profile(explainer_glm, "fare")
plot(expl_glm)
 # \donttest{
library("ranger")
titanic_ranger_model <- ranger(survived~., data = titanic_imputed, num.trees = 50,
probability = TRUE)
explainer_ranger <- explain(titanic_ranger_model, data = titanic_imputed)
#> Preparation of a new explainer is initiated
#> -> model label : ranger ( default )
#> -> data : 2207 rows 8 cols
#> -> target variable : not specified! ( WARNING )
#> -> predict function : yhat.ranger will be used ( default )
#> -> predicted values : No value for predict function target column. ( default )
#> -> model_info : package ranger , ver. 0.14.1 , task classification ( default )
#> -> model_info : Model info detected classification task but 'y' is a NULL . ( WARNING )
#> -> model_info : By deafult classification tasks supports only numercical 'y' parameter.
#> -> model_info : Consider changing to numerical vector with 0 and 1 values.
#> -> model_info : Otherwise I will not be able to calculate residuals or loss function.
#> -> predicted values : numerical, min = 0.01784213 , mean = 0.324549 , max = 0.9989255
#> -> residual function : difference between y and yhat ( default )
#> A new explainer has been created!
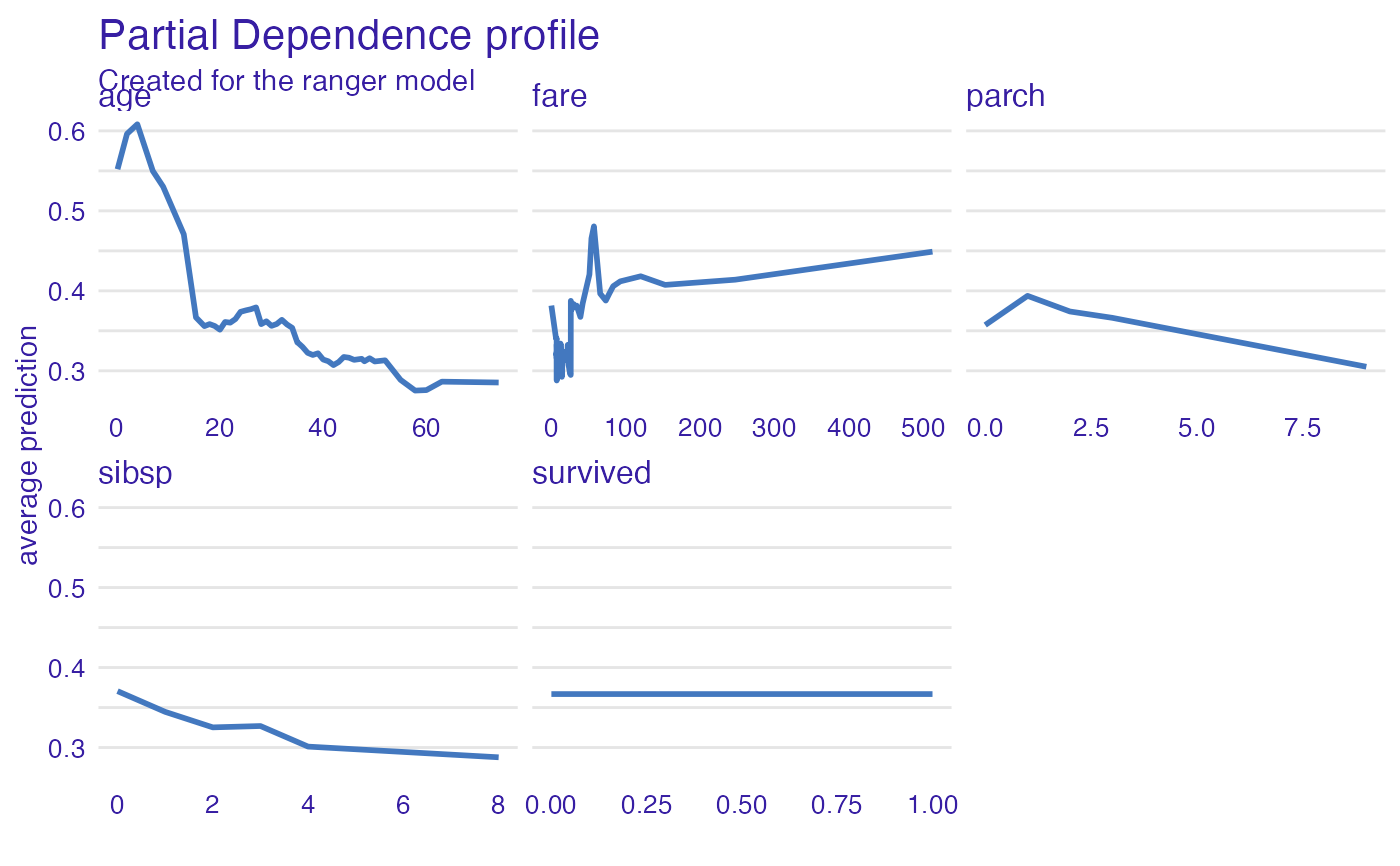
expl_ranger <- model_profile(explainer_ranger)
plot(expl_ranger)
# \donttest{
library("ranger")
titanic_ranger_model <- ranger(survived~., data = titanic_imputed, num.trees = 50,
probability = TRUE)
explainer_ranger <- explain(titanic_ranger_model, data = titanic_imputed)
#> Preparation of a new explainer is initiated
#> -> model label : ranger ( default )
#> -> data : 2207 rows 8 cols
#> -> target variable : not specified! ( WARNING )
#> -> predict function : yhat.ranger will be used ( default )
#> -> predicted values : No value for predict function target column. ( default )
#> -> model_info : package ranger , ver. 0.14.1 , task classification ( default )
#> -> model_info : Model info detected classification task but 'y' is a NULL . ( WARNING )
#> -> model_info : By deafult classification tasks supports only numercical 'y' parameter.
#> -> model_info : Consider changing to numerical vector with 0 and 1 values.
#> -> model_info : Otherwise I will not be able to calculate residuals or loss function.
#> -> predicted values : numerical, min = 0.01784213 , mean = 0.324549 , max = 0.9989255
#> -> residual function : difference between y and yhat ( default )
#> A new explainer has been created!
expl_ranger <- model_profile(explainer_ranger)
plot(expl_ranger)
 plot(expl_ranger, geom = "aggregates")
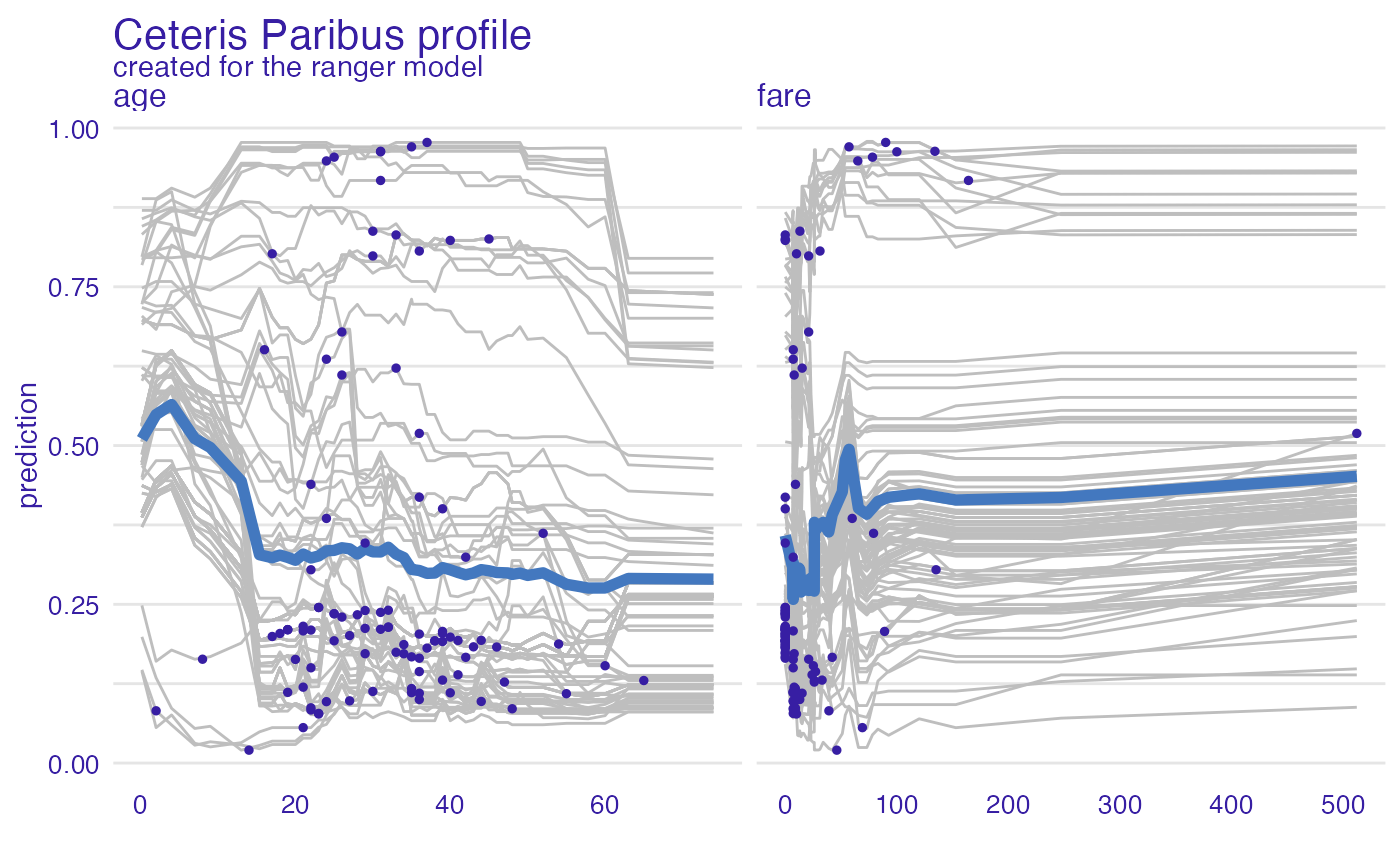
 vp_ra <- model_profile(explainer_ranger, type = "partial", variables = c("age", "fare"))
plot(vp_ra, variables = c("age", "fare"), geom = "points")
vp_ra <- model_profile(explainer_ranger, type = "partial", variables = c("age", "fare"))
plot(vp_ra, variables = c("age", "fare"), geom = "points")
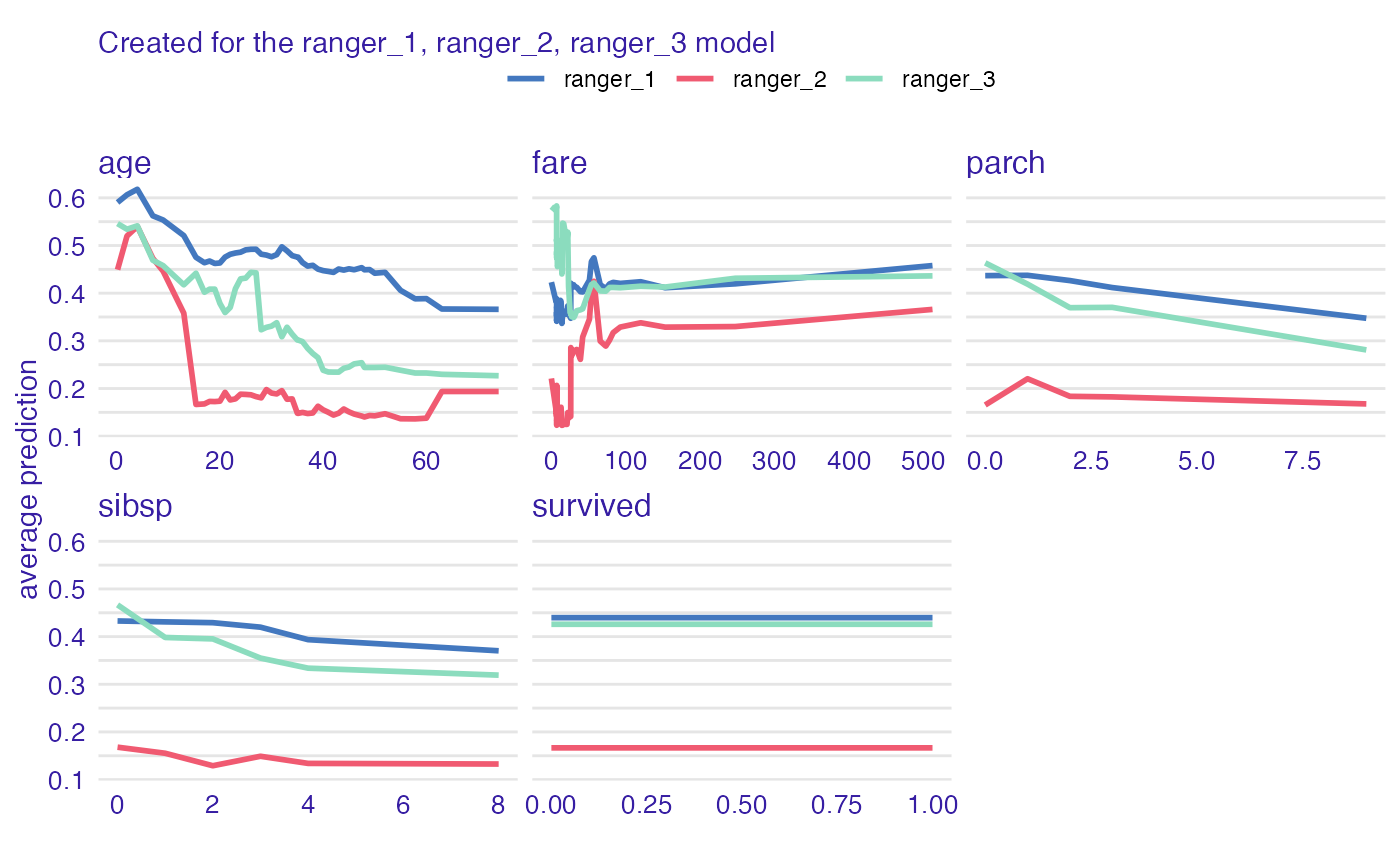
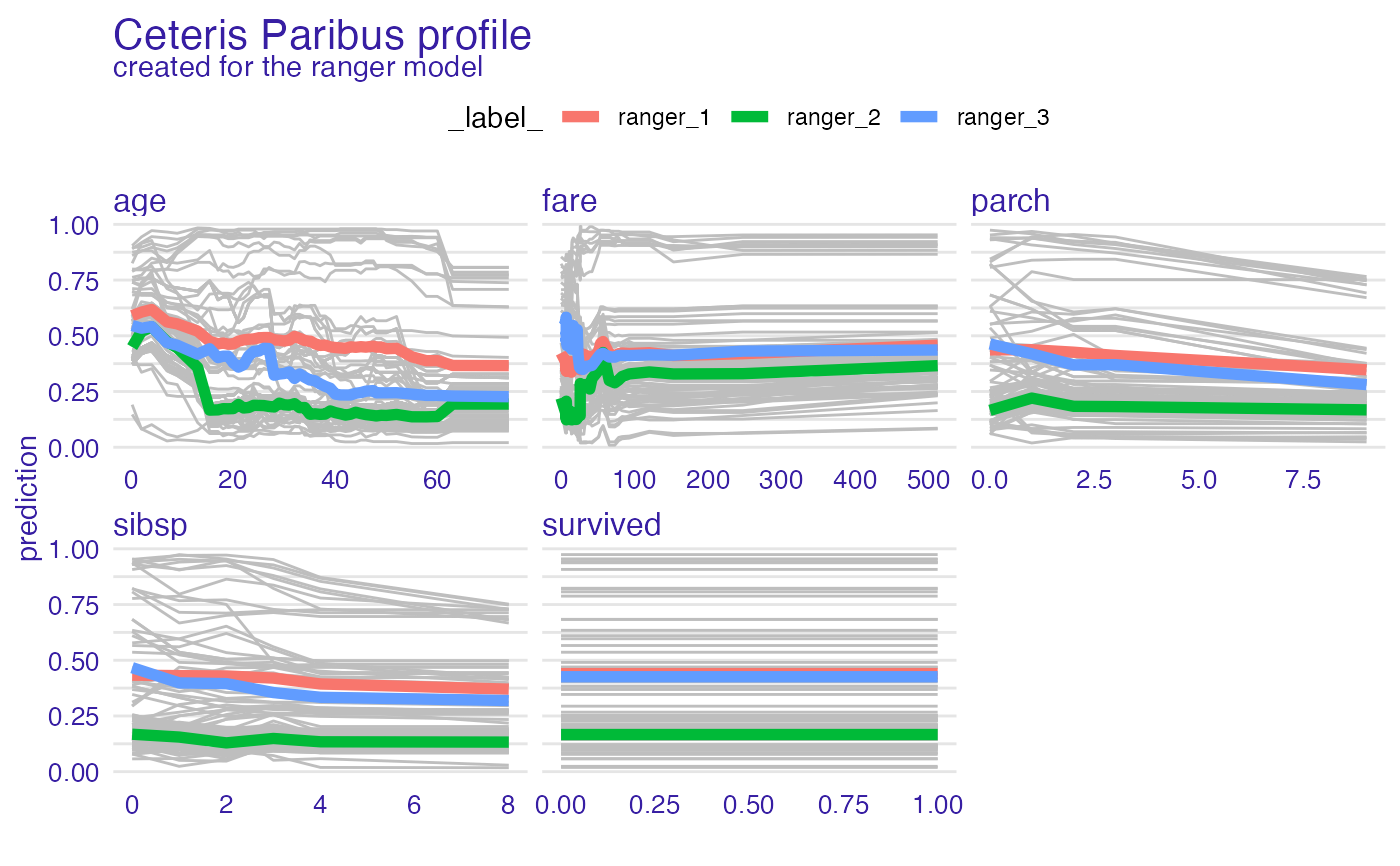
 vp_ra <- model_profile(explainer_ranger, type = "partial", k = 3)
plot(vp_ra)
vp_ra <- model_profile(explainer_ranger, type = "partial", k = 3)
plot(vp_ra)
 plot(vp_ra, geom = "profiles")
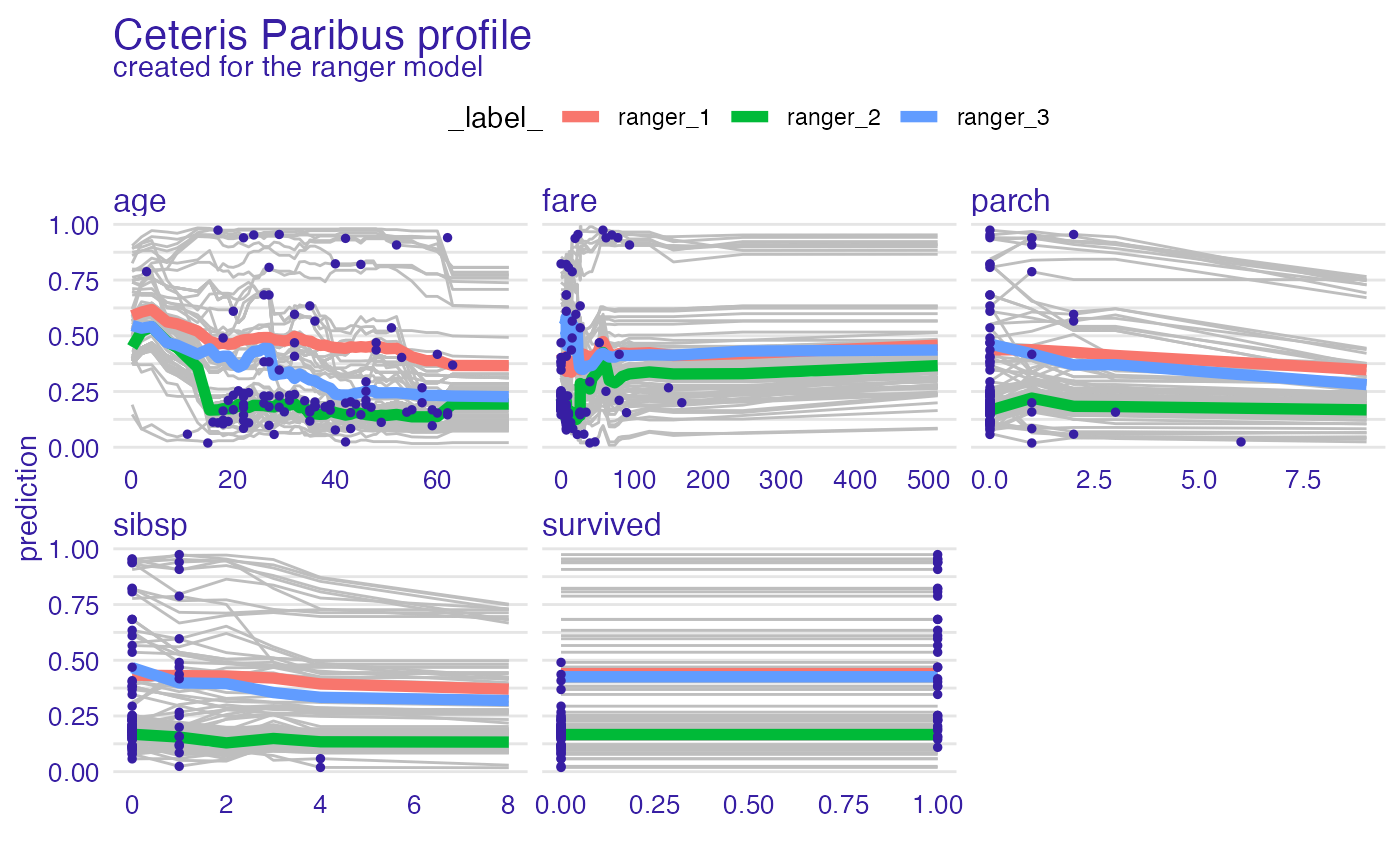
 plot(vp_ra, geom = "points")
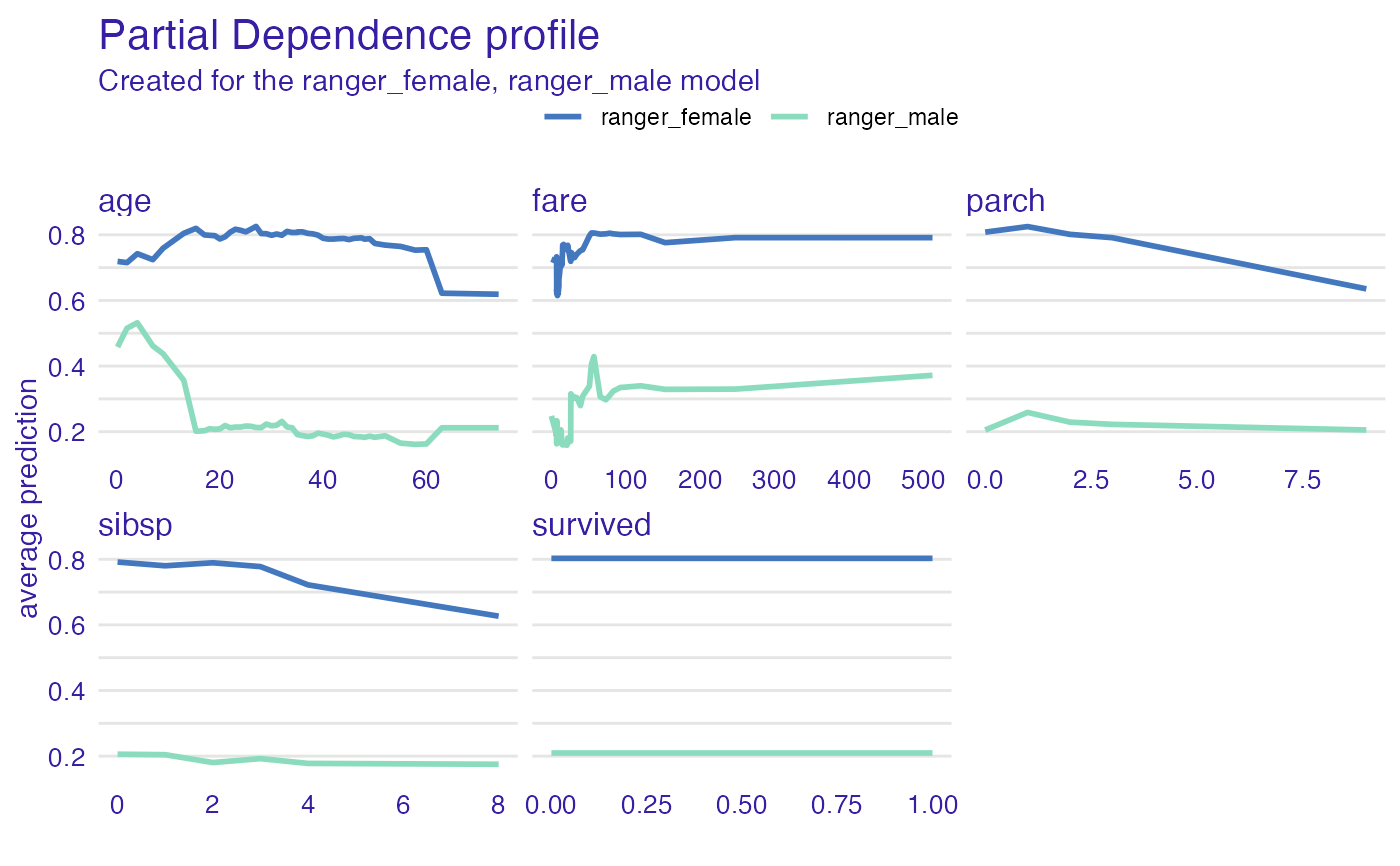
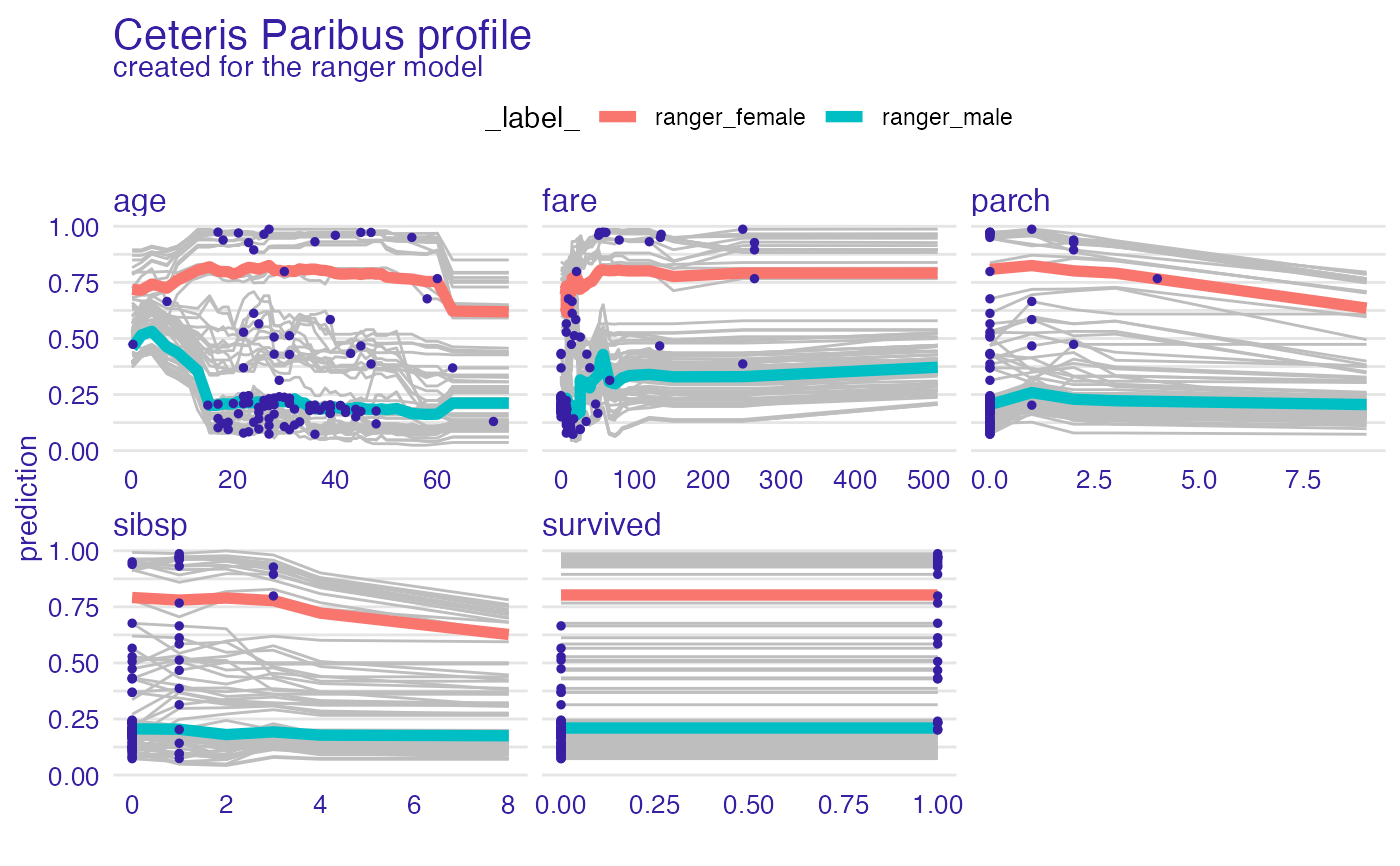
 vp_ra <- model_profile(explainer_ranger, type = "partial", groups = "gender")
plot(vp_ra)
vp_ra <- model_profile(explainer_ranger, type = "partial", groups = "gender")
plot(vp_ra)
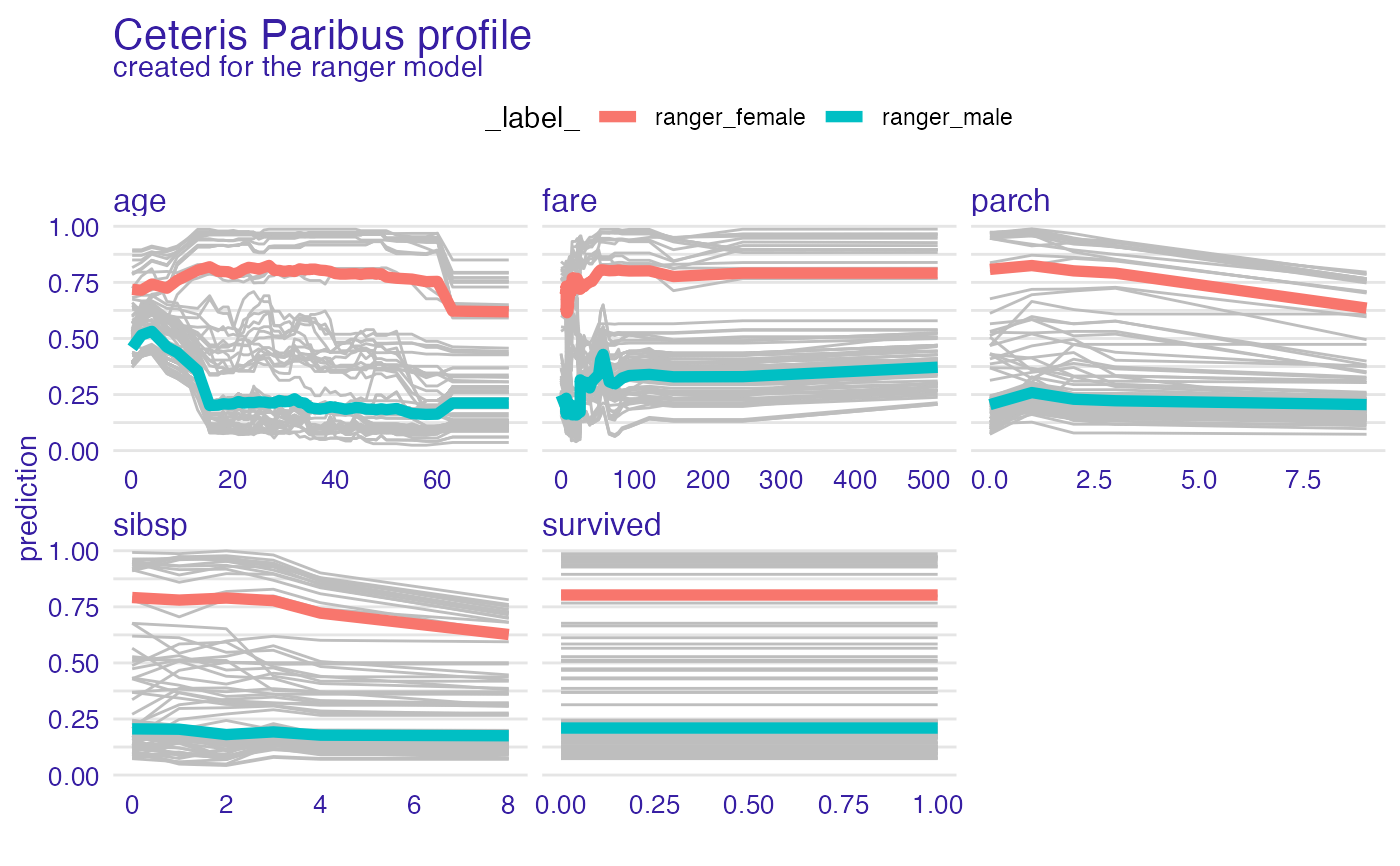
 plot(vp_ra, geom = "profiles")
 plot(vp_ra, geom = "points")
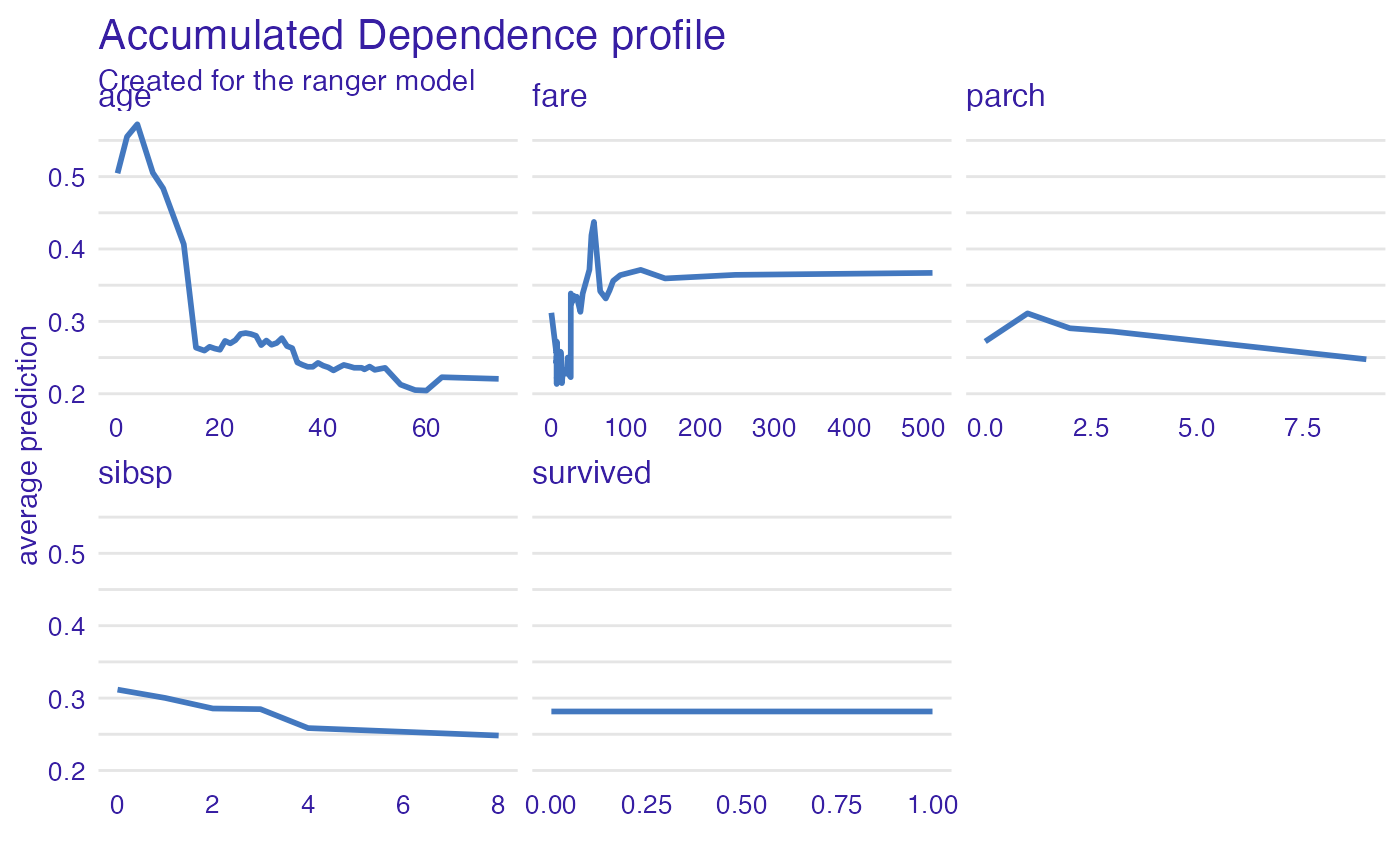
 vp_ra <- model_profile(explainer_ranger, type = "accumulated")
plot(vp_ra)
vp_ra <- model_profile(explainer_ranger, type = "accumulated")
plot(vp_ra)
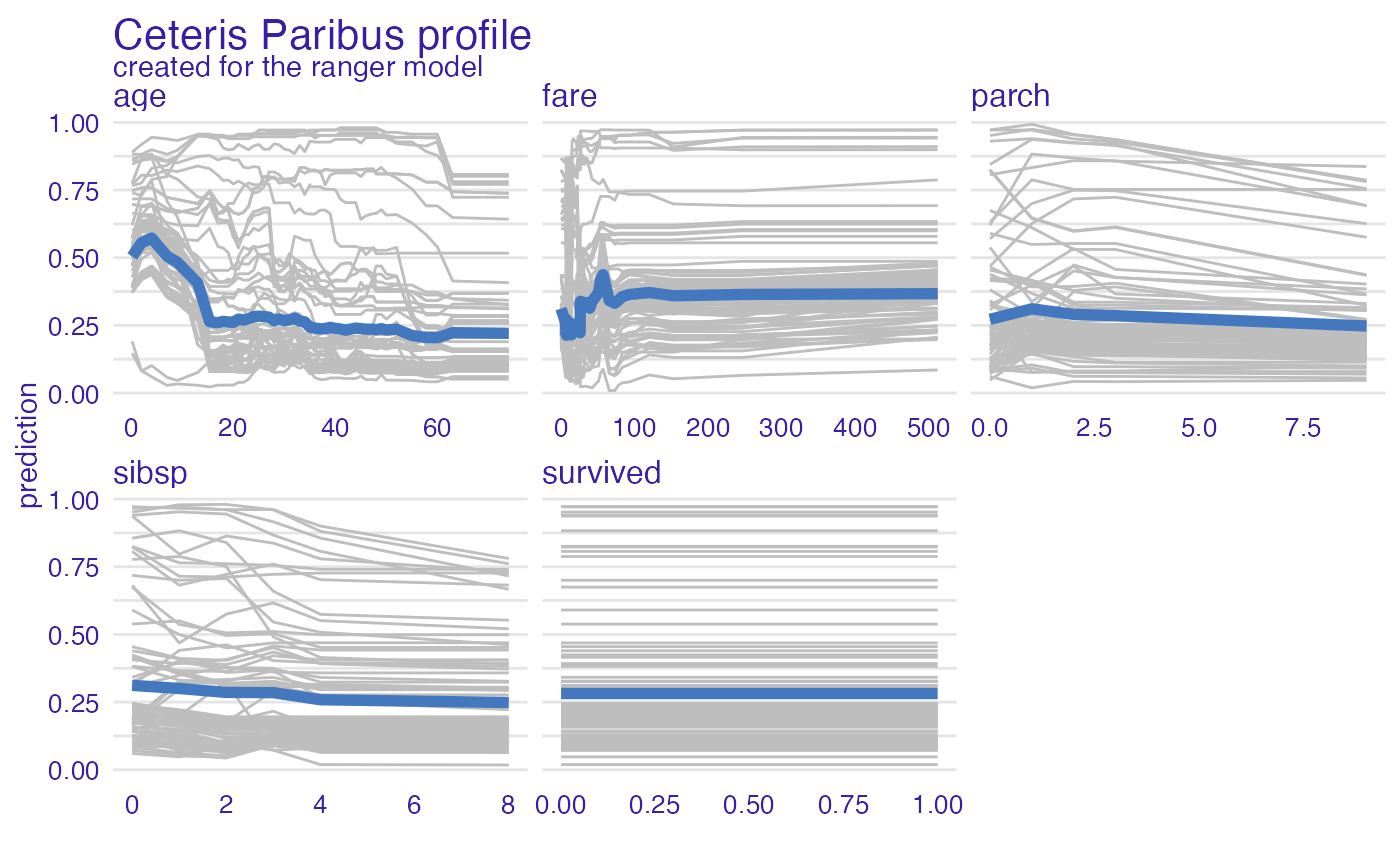
 plot(vp_ra, geom = "profiles")
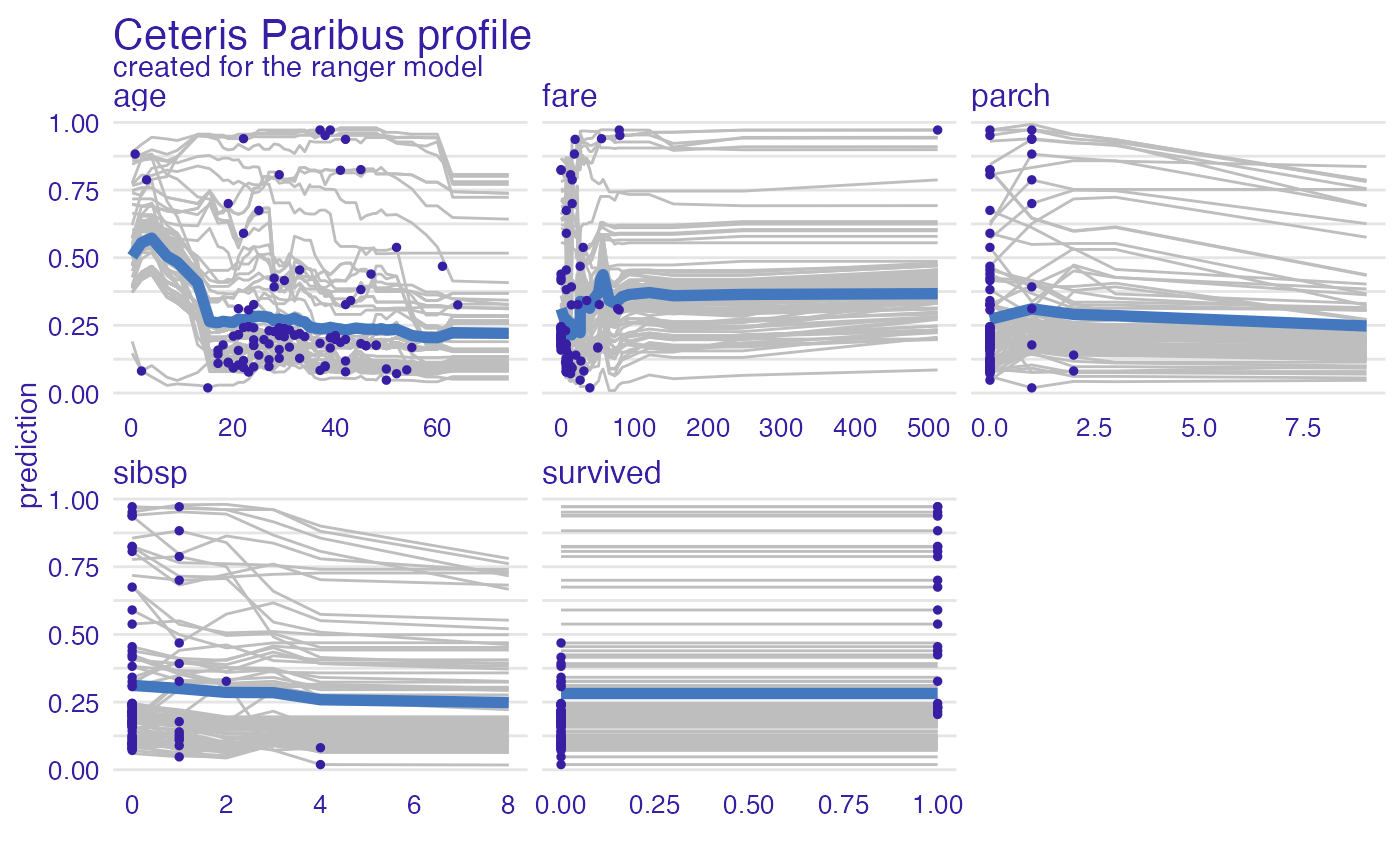
 plot(vp_ra, geom = "points")
 # }
# }