Dataset Level Variable Profile as Partial Dependence or Accumulated Local Dependence Explanations
Source:R/model_profile.R
model_profile.RdThis function calculates explanations on a dataset level set that explore model response as a function of selected variables.
The explanations can be calulated as Partial Dependence Profile or Accumulated Local Dependence Profile.
Find information how to use this function here: https://ema.drwhy.ai/partialDependenceProfiles.html.
The variable_profile function is a copy of model_profile.
model_profile(
  explainer,
  variables = NULL,
  N = 100,
  ...,
  groups = NULL,
  k = NULL,
  center = TRUE,
  type = "partial"
)

variable_profile(
  explainer,
  variables = NULL,
  N = 100,
  ...,
  groups = NULL,
  k = NULL,
  center = TRUE,
  type = "partial"
)

single_variable(explainer, variable, type = "pdp", ...)
Arguments
- explainer
a model to be explained, preprocessed by the
explainfunction- variables
character - names of variables to be explained
- N
number of observations used for calculation of aggregated profiles. By default
100. UseNULLto use all observations.- ...
other parameters that will be passed to
ingredients::aggregate_profiles- groups
a variable name that will be used for grouping. By default
NULLwhich means that no groups shall be calculated- k
number of clusters for the hclust function (for clustered profiles)
- center
shall profiles be centered before clustering
- type
the type of variable profile. Either
partial,conditionaloraccumulated.- variable
deprecated, use variables instead
Value
An object of the class model_profile.
It's a data frame with calculated average model responses.
Details
Underneath this function calls the partial_dependence or
accumulated_dependence functions from the ingredients package.
References
Explanatory Model Analysis. Explore, Explain, and Examine Predictive Models. https://ema.drwhy.ai/
Examples
titanic_glm_model <- glm(survived~., data = titanic_imputed, family = "binomial")
explainer_glm <- explain(titanic_glm_model, data = titanic_imputed)
#> Preparation of a new explainer is initiated
#> -> model label : lm ( default )
#> -> data : 2207 rows 8 cols
#> -> target variable : not specified! ( WARNING )
#> -> predict function : yhat.glm will be used ( default )
#> -> predicted values : No value for predict function target column. ( default )
#> -> model_info : package stats , ver. 4.2.3 , task classification ( default )
#> -> model_info : Model info detected classification task but 'y' is a NULL . ( WARNING )
#> -> model_info : By deafult classification tasks supports only numercical 'y' parameter.
#> -> model_info : Consider changing to numerical vector with 0 and 1 values.
#> -> model_info : Otherwise I will not be able to calculate residuals or loss function.
#> -> predicted values : numerical, min = 0.008128381 , mean = 0.3221568 , max = 0.9731431
#> -> residual function : difference between y and yhat ( default )
#> A new explainer has been created!
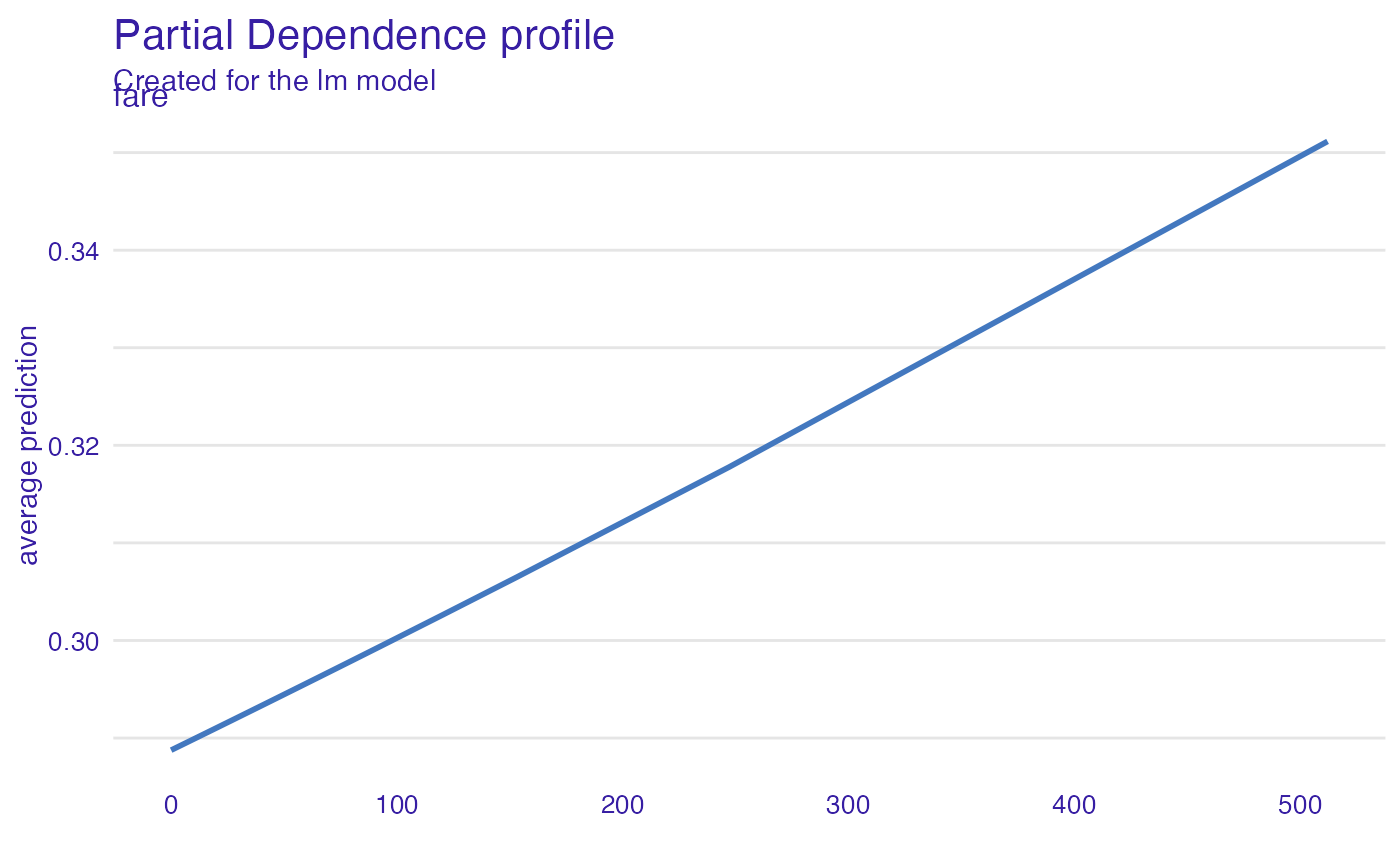
model_profile_glm_fare <- model_profile(explainer_glm, "fare")
plot(model_profile_glm_fare)
 # \donttest{
library("ranger")
titanic_ranger_model <- ranger(survived~., data = titanic_imputed, num.trees = 50,
probability = TRUE)
explainer_ranger <- explain(titanic_ranger_model, data = titanic_imputed)
#> Preparation of a new explainer is initiated
#> -> model label : ranger ( default )
#> -> data : 2207 rows 8 cols
#> -> target variable : not specified! ( WARNING )
#> -> predict function : yhat.ranger will be used ( default )
#> -> predicted values : No value for predict function target column. ( default )
#> -> model_info : package ranger , ver. 0.14.1 , task classification ( default )
#> -> model_info : Model info detected classification task but 'y' is a NULL . ( WARNING )
#> -> model_info : By deafult classification tasks supports only numercical 'y' parameter.
#> -> model_info : Consider changing to numerical vector with 0 and 1 values.
#> -> model_info : Otherwise I will not be able to calculate residuals or loss function.
#> -> predicted values : numerical, min = 0.007194627 , mean = 0.3204426 , max = 0.9986442
#> -> residual function : difference between y and yhat ( default )
#> A new explainer has been created!
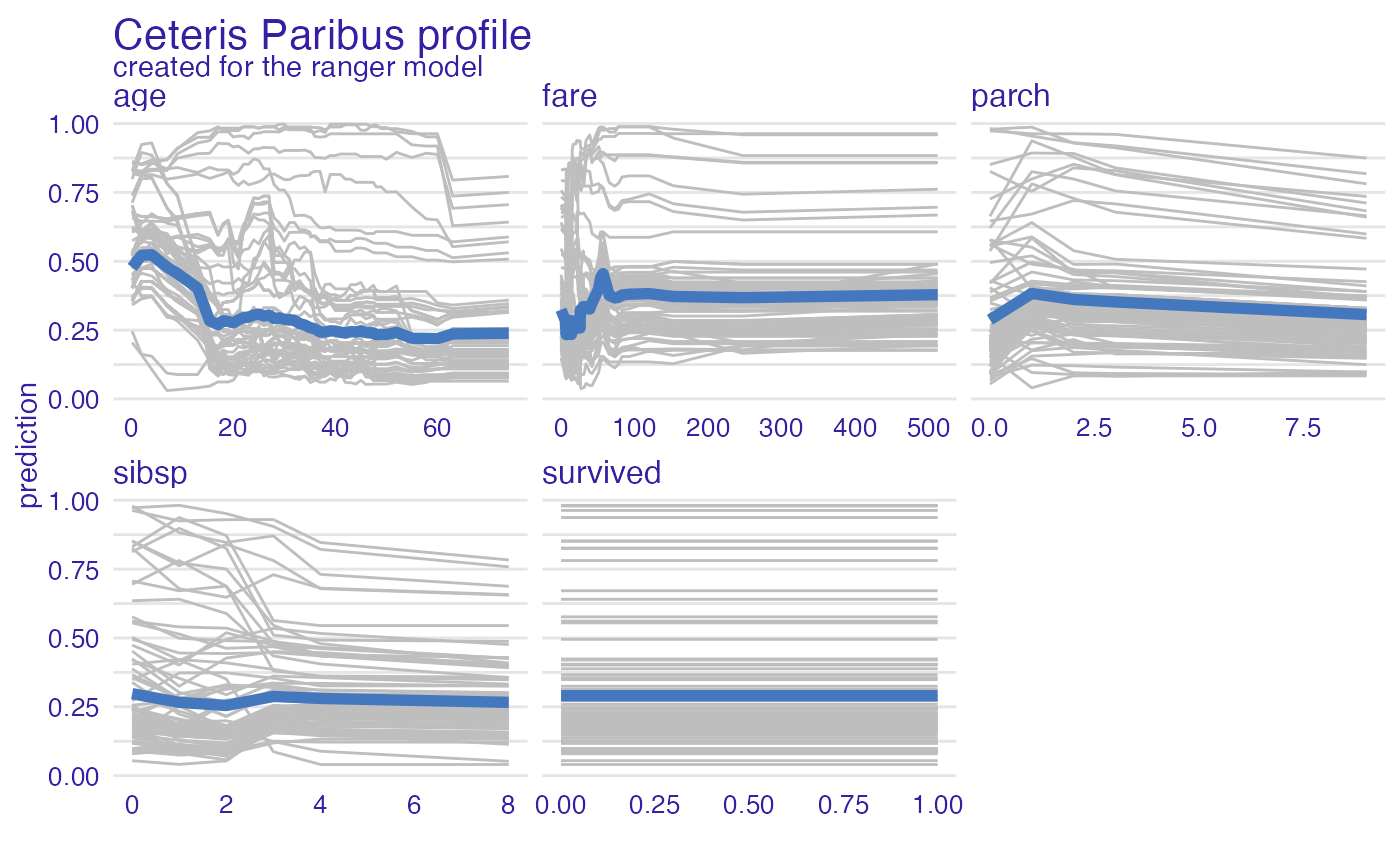
model_profile_ranger <- model_profile(explainer_ranger)
plot(model_profile_ranger, geom = "profiles")
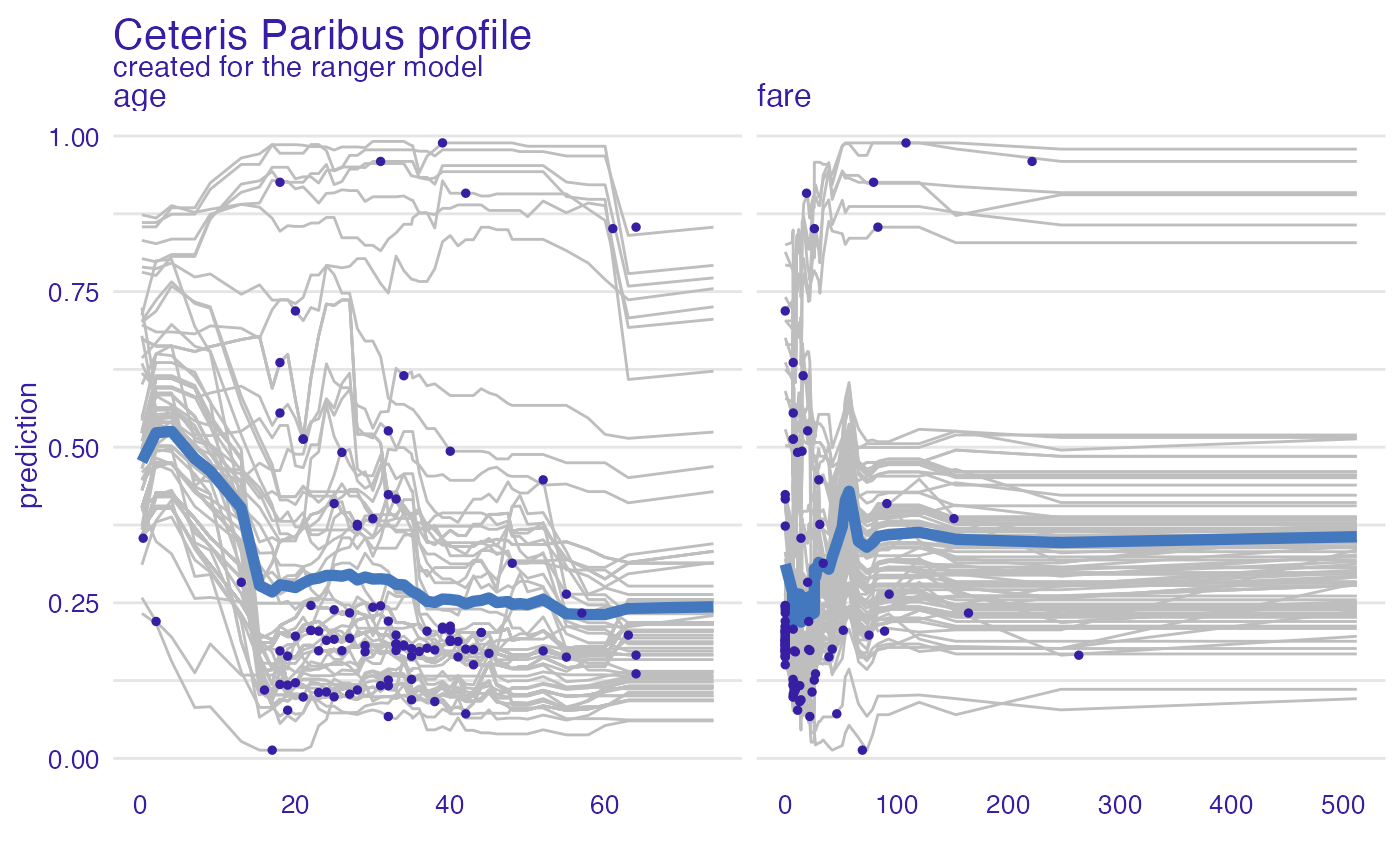
 model_profile_ranger_1 <- model_profile(explainer_ranger, type = "partial",
variables = c("age", "fare"))
plot(model_profile_ranger_1 , variables = c("age", "fare"), geom = "points")
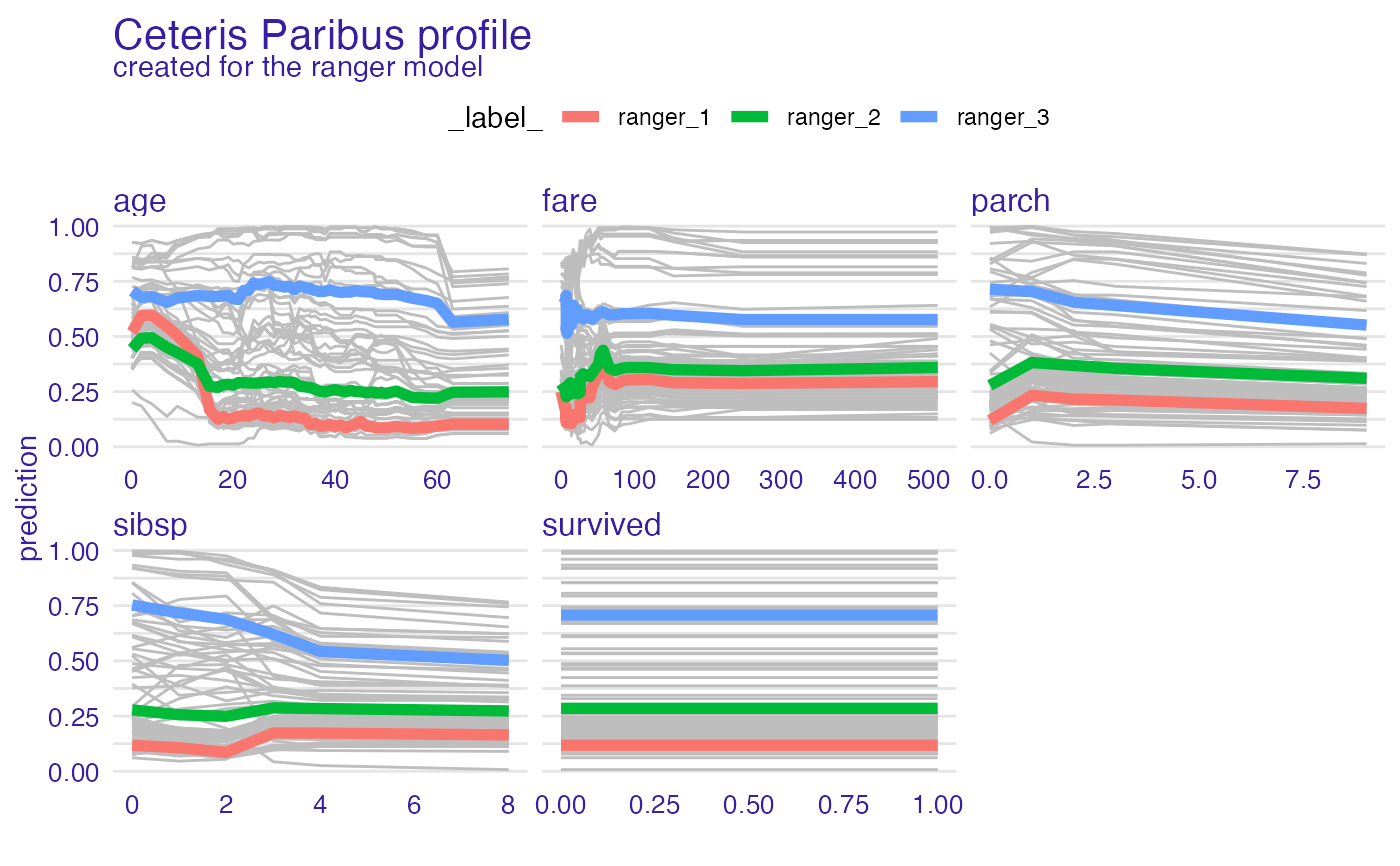
 model_profile_ranger_2 <- model_profile(explainer_ranger, type = "partial", k = 3)
plot(model_profile_ranger_2 , geom = "profiles")
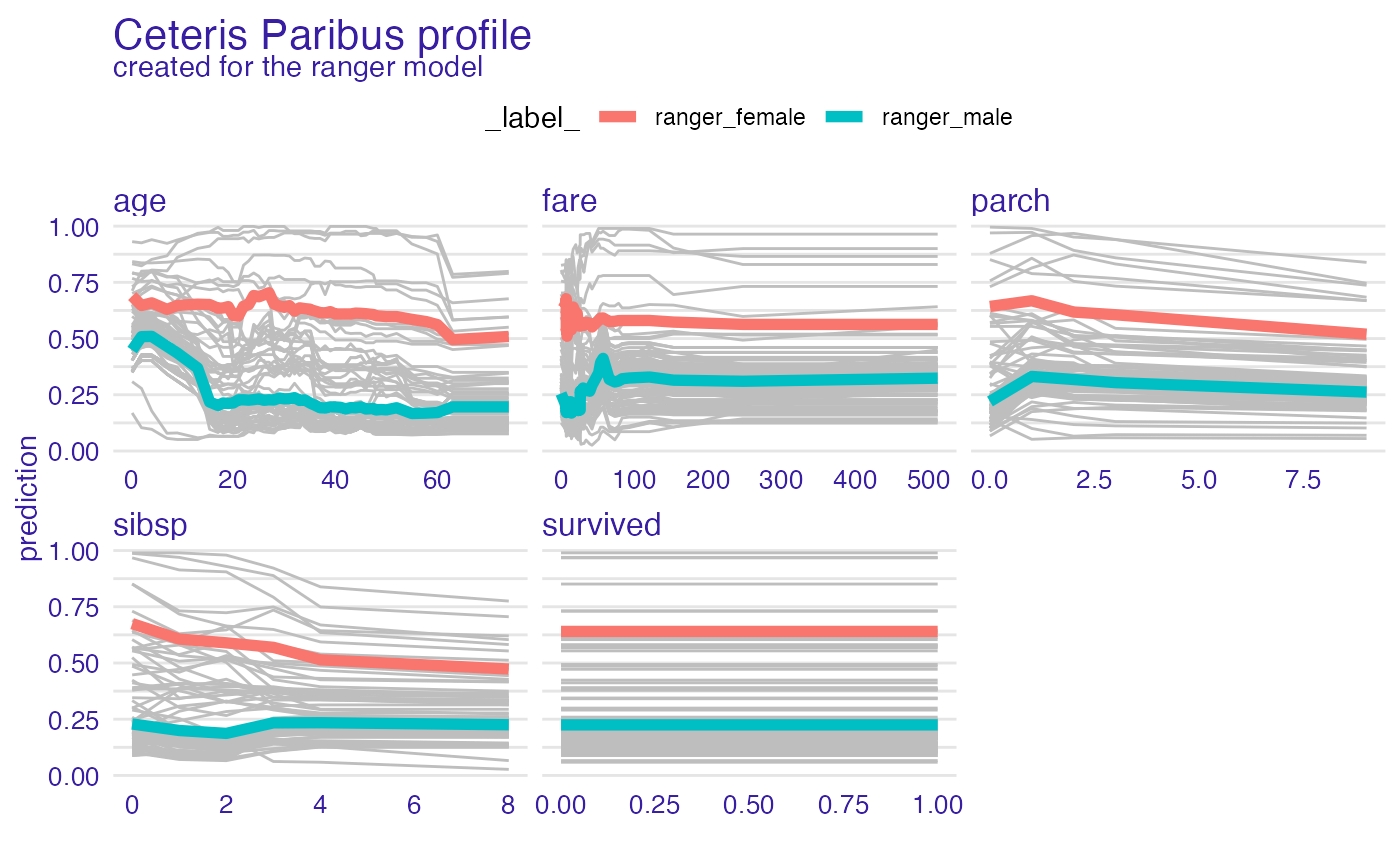
 model_profile_ranger_3 <- model_profile(explainer_ranger, type = "partial", groups = "gender")
plot(model_profile_ranger_3 , geom = "profiles")
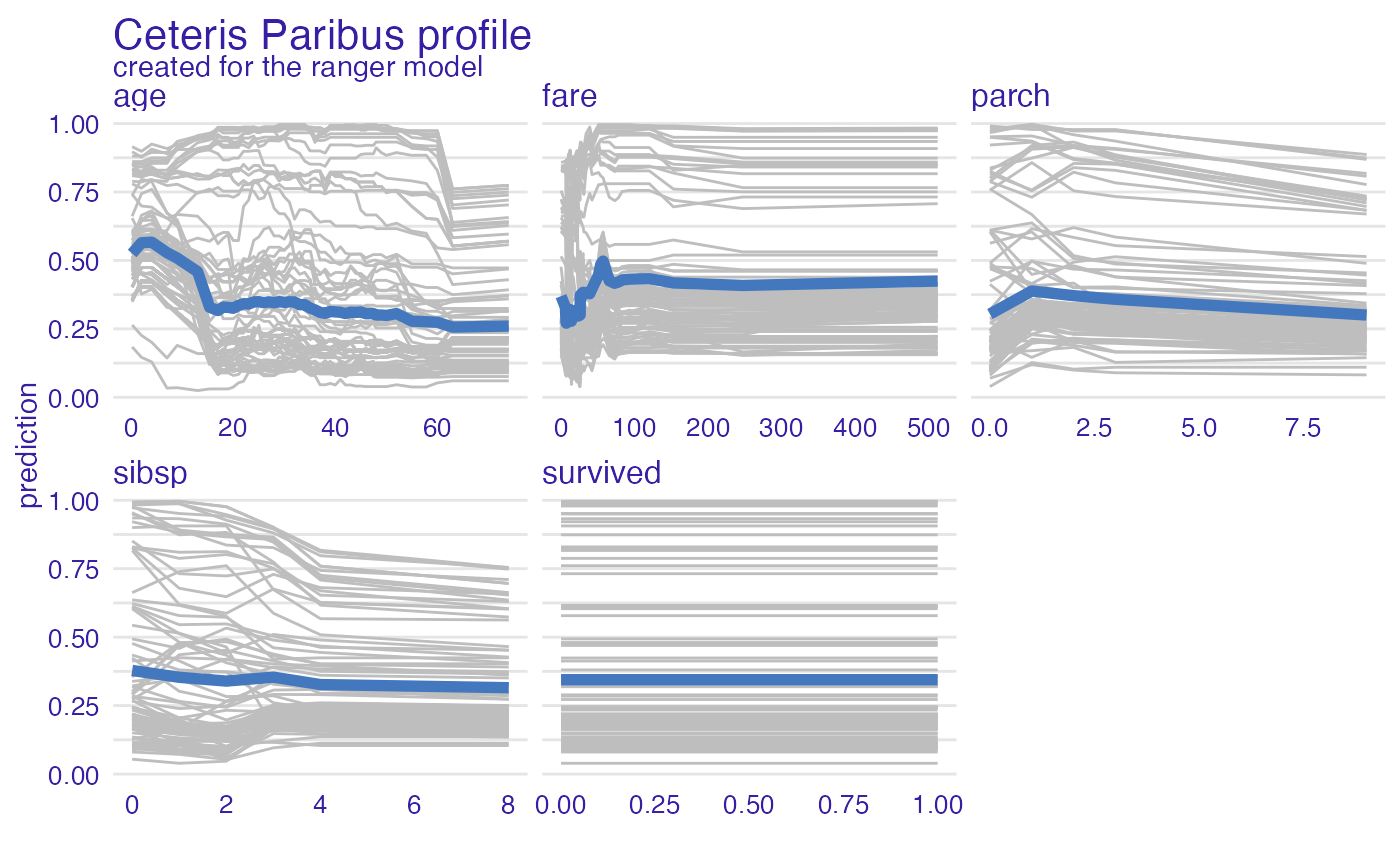
 model_profile_ranger_4 <- model_profile(explainer_ranger, type = "accumulated")
plot(model_profile_ranger_4 , geom = "profiles")
 # Multiple profiles
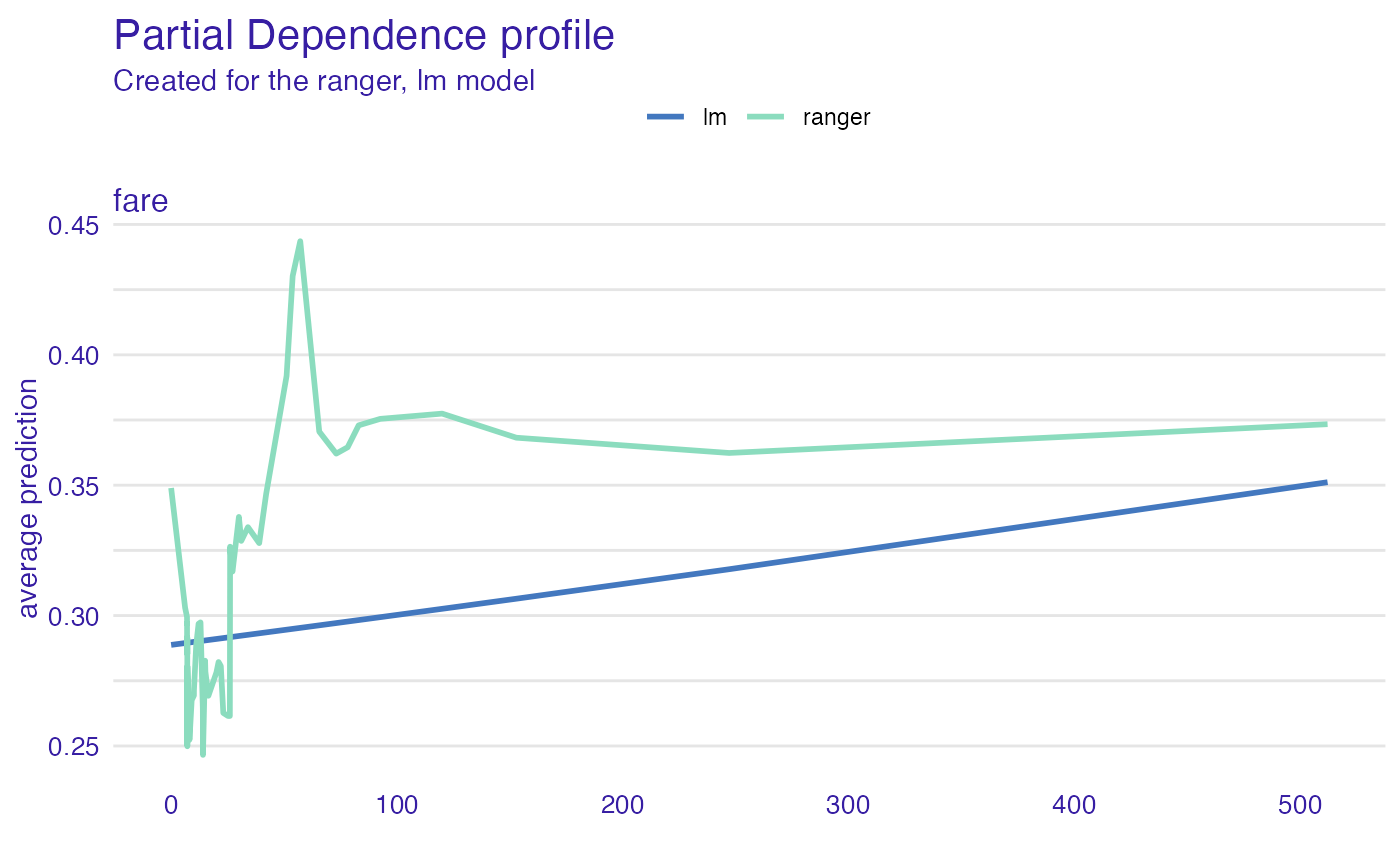
model_profile_ranger_fare <- model_profile(explainer_ranger, "fare")
plot(model_profile_ranger_fare, model_profile_glm_fare)
 # }
# }