Plot Dataset Level Model Performance Explanations
Source:R/plot_model_performance.R
plot.model_performance.RdPlot Dataset Level Model Performance Explanations
Arguments
- x
a model to be explained, preprocessed by the
explainfunction- ...
other parameters
- geom
either
"prc","roc","ecdf","boxplot","gain","lift"or"histogram"determines how residuals shall be summarized- show_outliers
number of largest residuals to be presented (only when geom = boxplot).
- ptlabel
either
"name"or"index"determines the naming convention of the outliers- lossFunction
alias for
loss_functionheld for backwards compatibility.- loss_function
function that calculates the loss for a model based on model residuals. By default it's the root mean square. NOTE that this argument was called
lossFunction.
Value
An object of the class model_performance.
Examples
# \donttest{
library("ranger")
titanic_ranger_model <- ranger(survived~., data = titanic_imputed, num.trees = 50,
probability = TRUE)
explainer_ranger <- explain(titanic_ranger_model, data = titanic_imputed[,-8],
y = titanic_imputed$survived)
#> Preparation of a new explainer is initiated
#> -> model label : ranger ( default )
#> -> data : 2207 rows 7 cols
#> -> target variable : 2207 values
#> -> predict function : yhat.ranger will be used ( default )
#> -> predicted values : No value for predict function target column. ( default )
#> -> model_info : package ranger , ver. 0.14.1 , task classification ( default )
#> -> predicted values : numerical, min = 0.01371476 , mean = 0.323441 , max = 0.9989516
#> -> residual function : difference between y and yhat ( default )
#> -> residuals : numerical, min = -0.8007065 , mean = -0.001284211 , max = 0.9012612
#> A new explainer has been created!
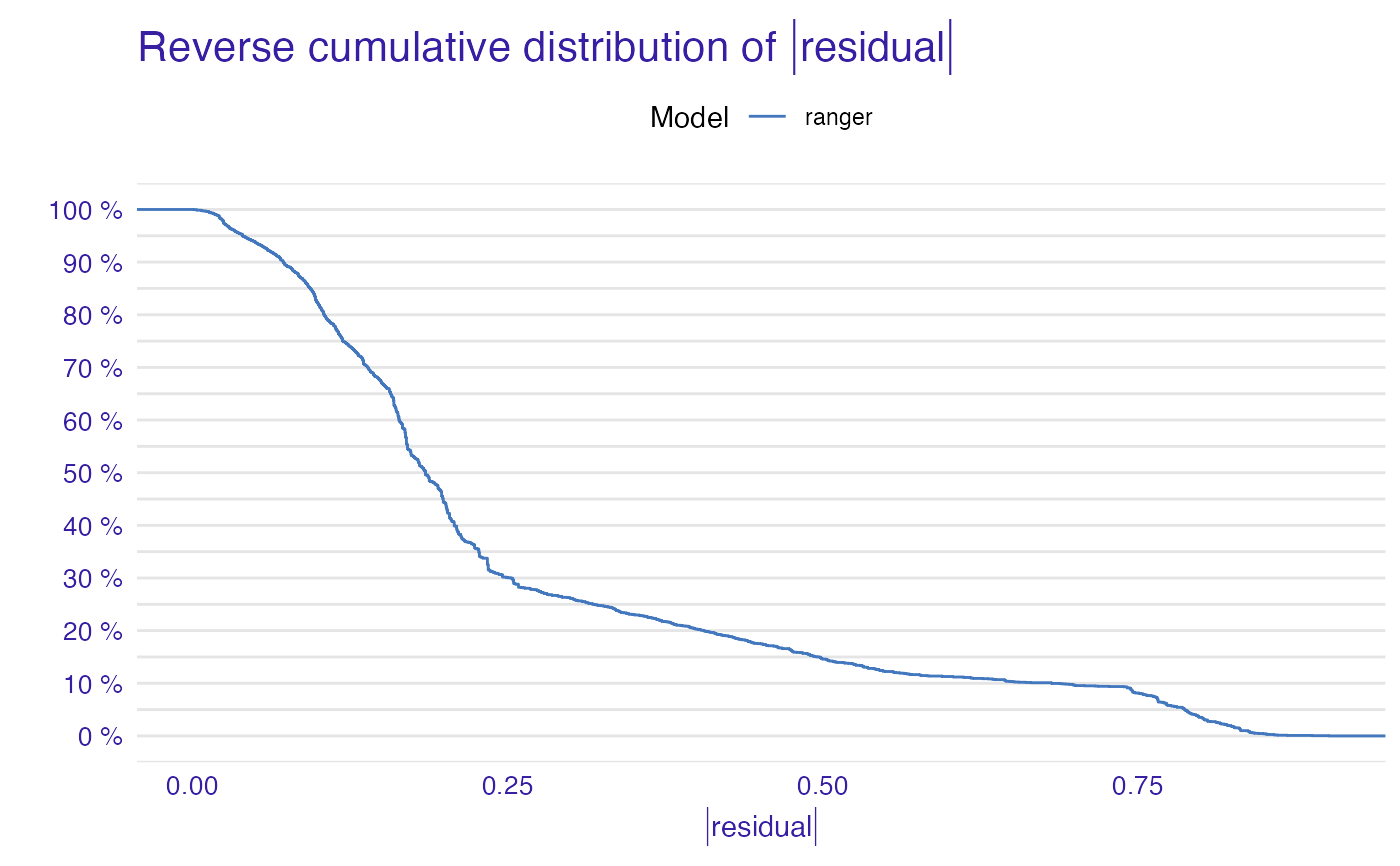
mp_ranger <- model_performance(explainer_ranger)
plot(mp_ranger)
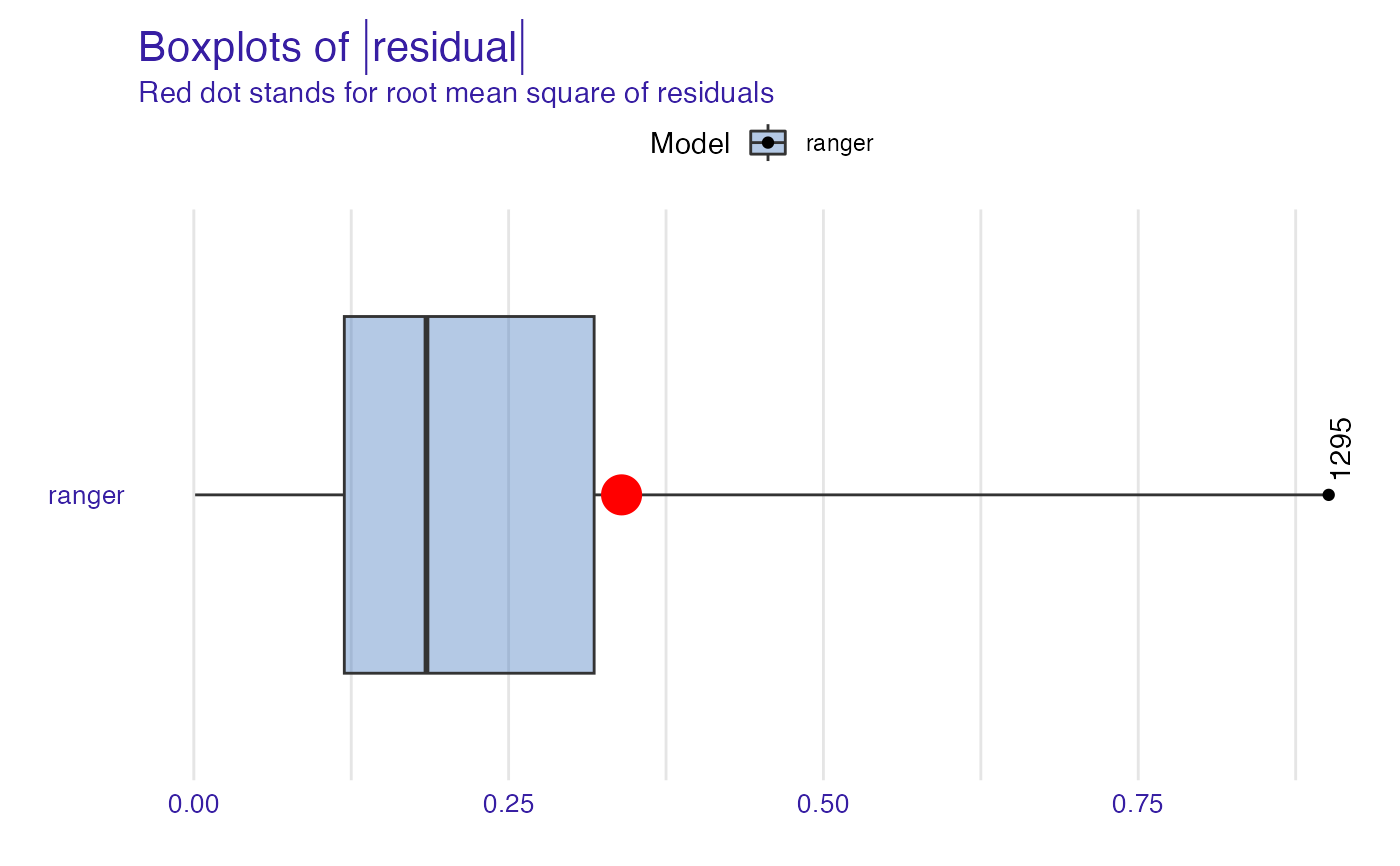
 plot(mp_ranger, geom = "boxplot", show_outliers = 1)
 titanic_ranger_model2 <- ranger(survived~gender + fare, data = titanic_imputed,
num.trees = 50, probability = TRUE)
explainer_ranger2 <- explain(titanic_ranger_model2, data = titanic_imputed[,-8],
y = titanic_imputed$survived,
label = "ranger2")
#> Preparation of a new explainer is initiated
#> -> model label : ranger2
#> -> data : 2207 rows 7 cols
#> -> target variable : 2207 values
#> -> predict function : yhat.ranger will be used ( default )
#> -> predicted values : No value for predict function target column. ( default )
#> -> model_info : package ranger , ver. 0.14.1 , task classification ( default )
#> -> predicted values : numerical, min = 0.1563426 , mean = 0.3238786 , max = 0.8981926
#> -> residual function : difference between y and yhat ( default )
#> -> residuals : numerical, min = -0.8331378 , mean = -0.001721811 , max = 0.8427046
#> A new explainer has been created!
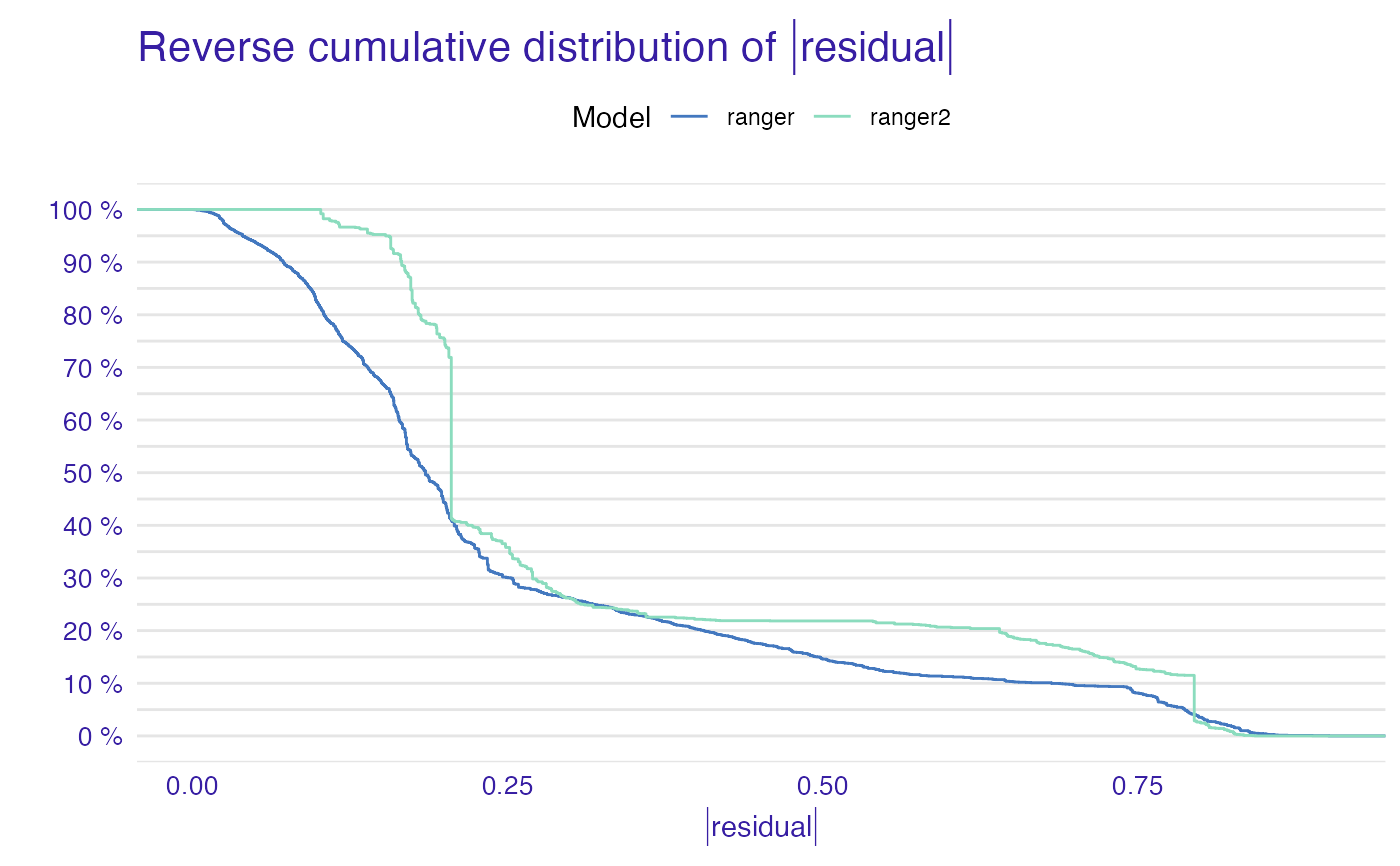
mp_ranger2 <- model_performance(explainer_ranger2)
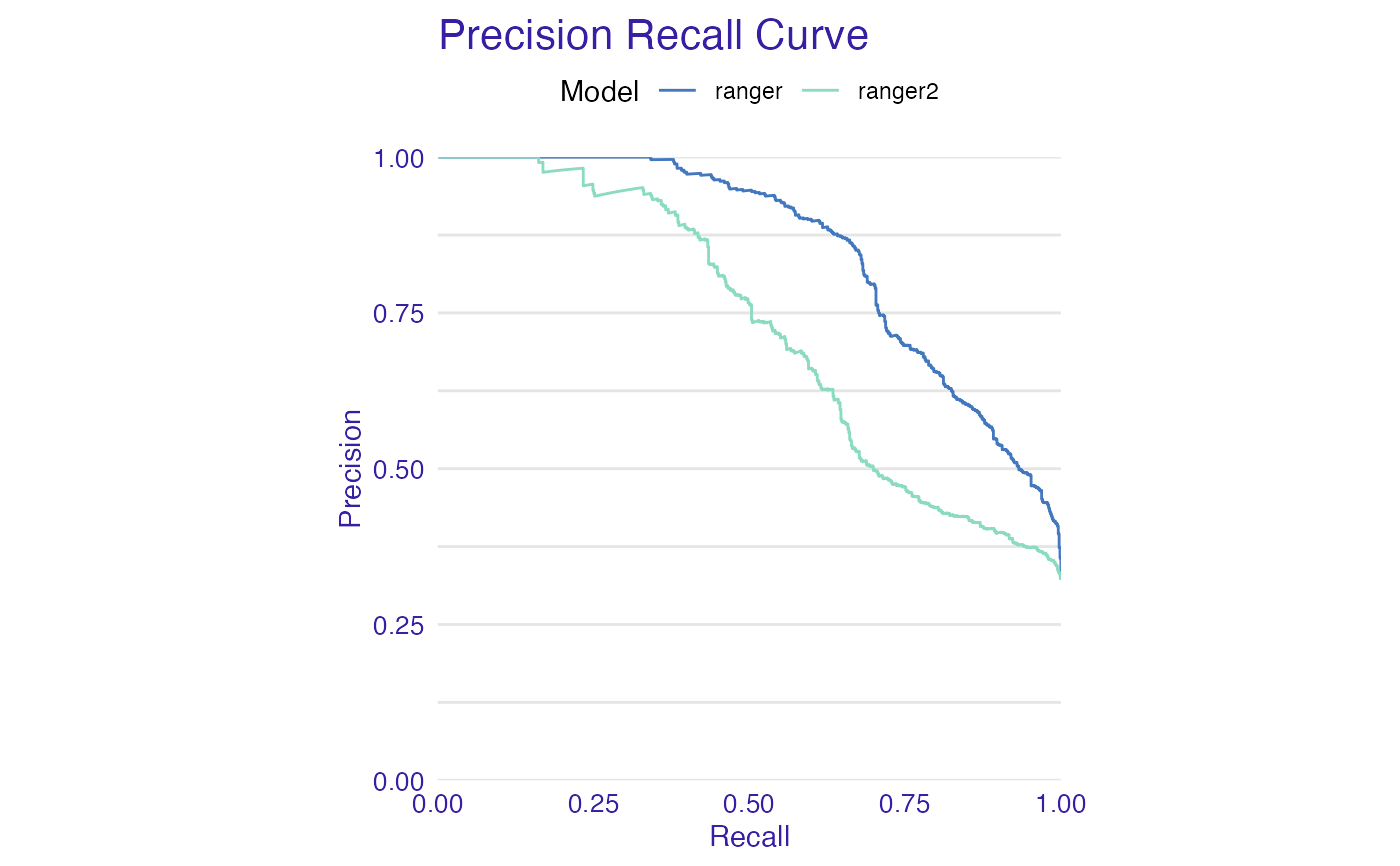
plot(mp_ranger, mp_ranger2, geom = "prc")
titanic_ranger_model2 <- ranger(survived~gender + fare, data = titanic_imputed,
num.trees = 50, probability = TRUE)
explainer_ranger2 <- explain(titanic_ranger_model2, data = titanic_imputed[,-8],
y = titanic_imputed$survived,
label = "ranger2")
#> Preparation of a new explainer is initiated
#> -> model label : ranger2
#> -> data : 2207 rows 7 cols
#> -> target variable : 2207 values
#> -> predict function : yhat.ranger will be used ( default )
#> -> predicted values : No value for predict function target column. ( default )
#> -> model_info : package ranger , ver. 0.14.1 , task classification ( default )
#> -> predicted values : numerical, min = 0.1563426 , mean = 0.3238786 , max = 0.8981926
#> -> residual function : difference between y and yhat ( default )
#> -> residuals : numerical, min = -0.8331378 , mean = -0.001721811 , max = 0.8427046
#> A new explainer has been created!
mp_ranger2 <- model_performance(explainer_ranger2)
plot(mp_ranger, mp_ranger2, geom = "prc")
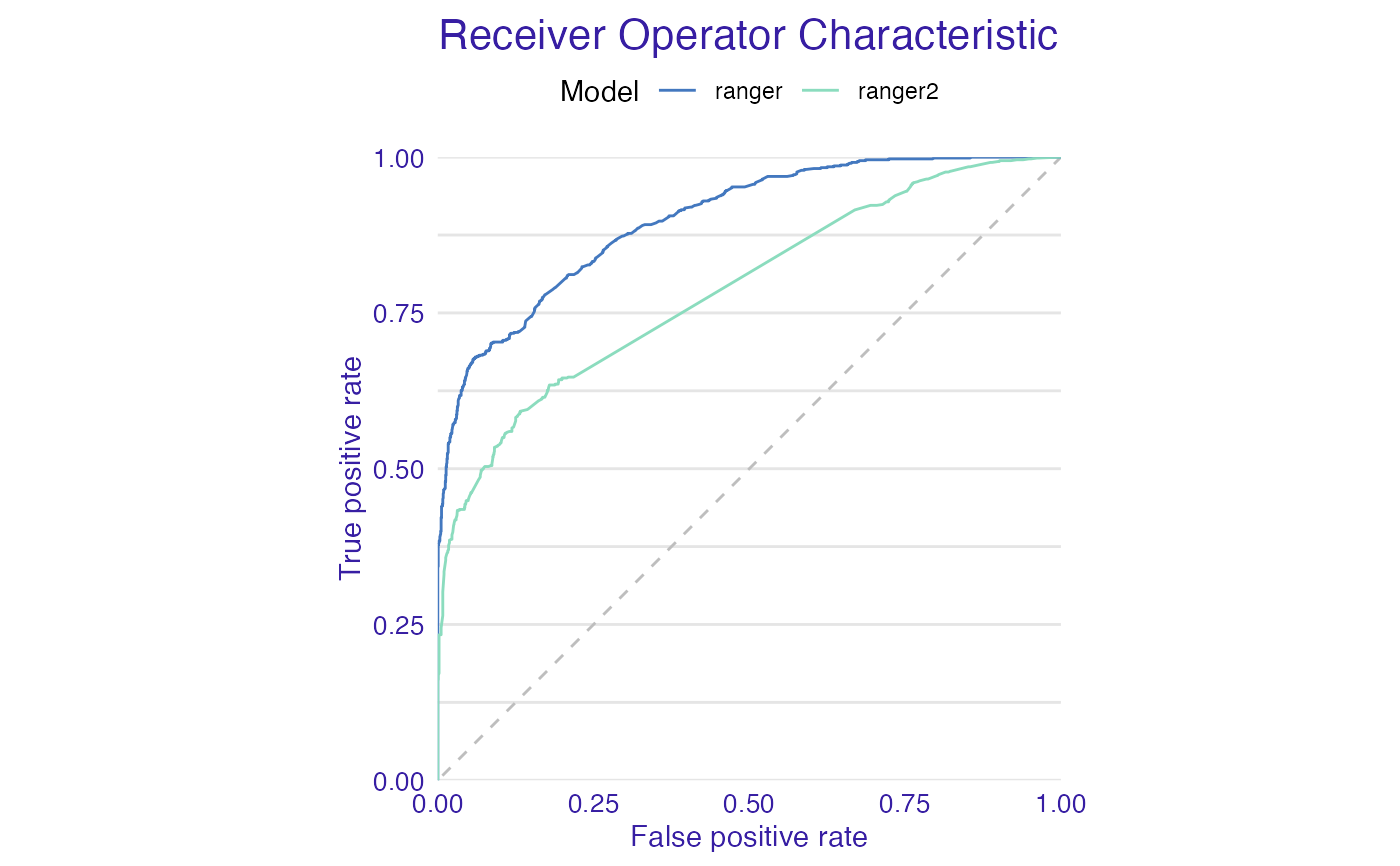
 plot(mp_ranger, mp_ranger2, geom = "roc")
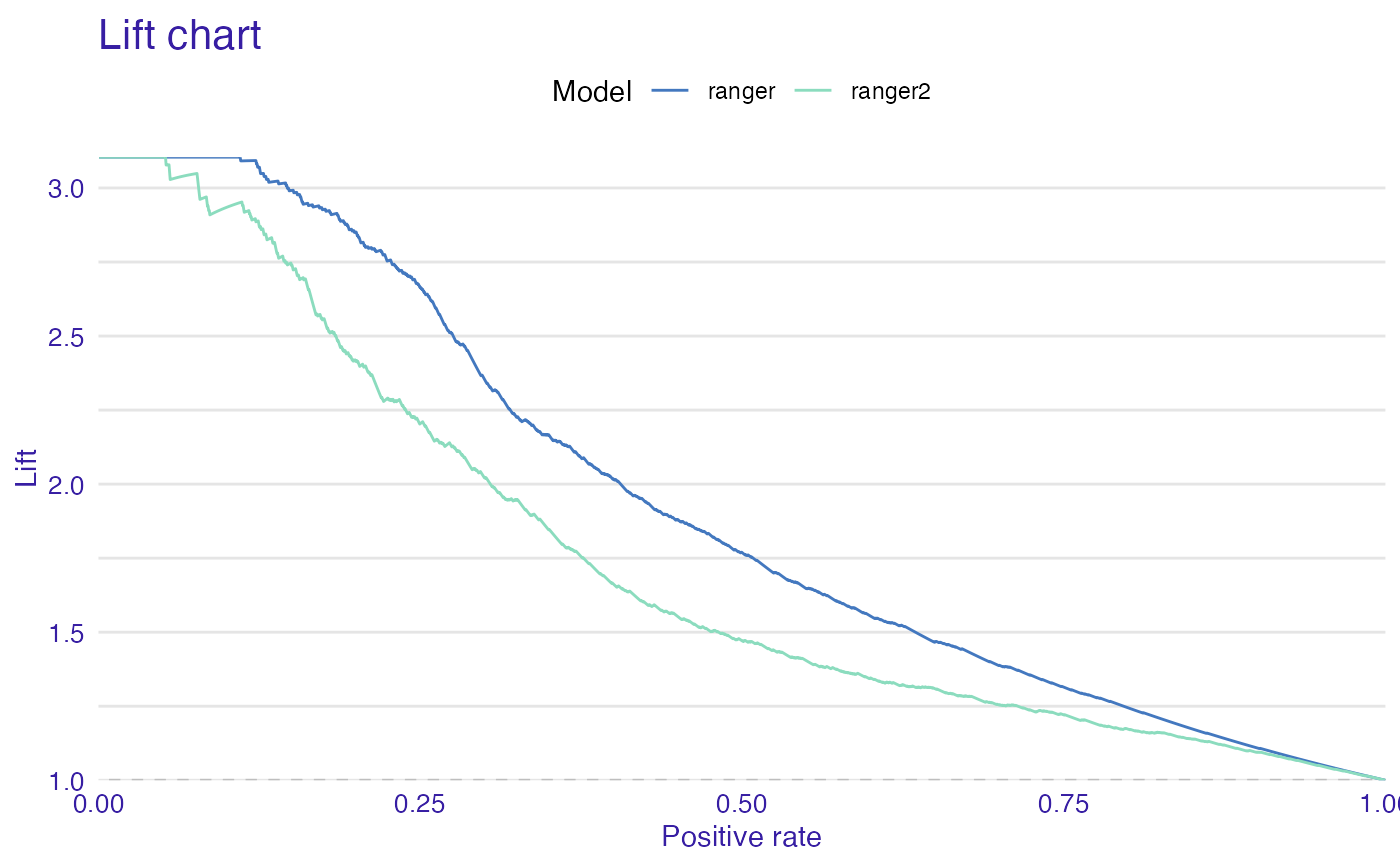
 plot(mp_ranger, mp_ranger2, geom = "lift")
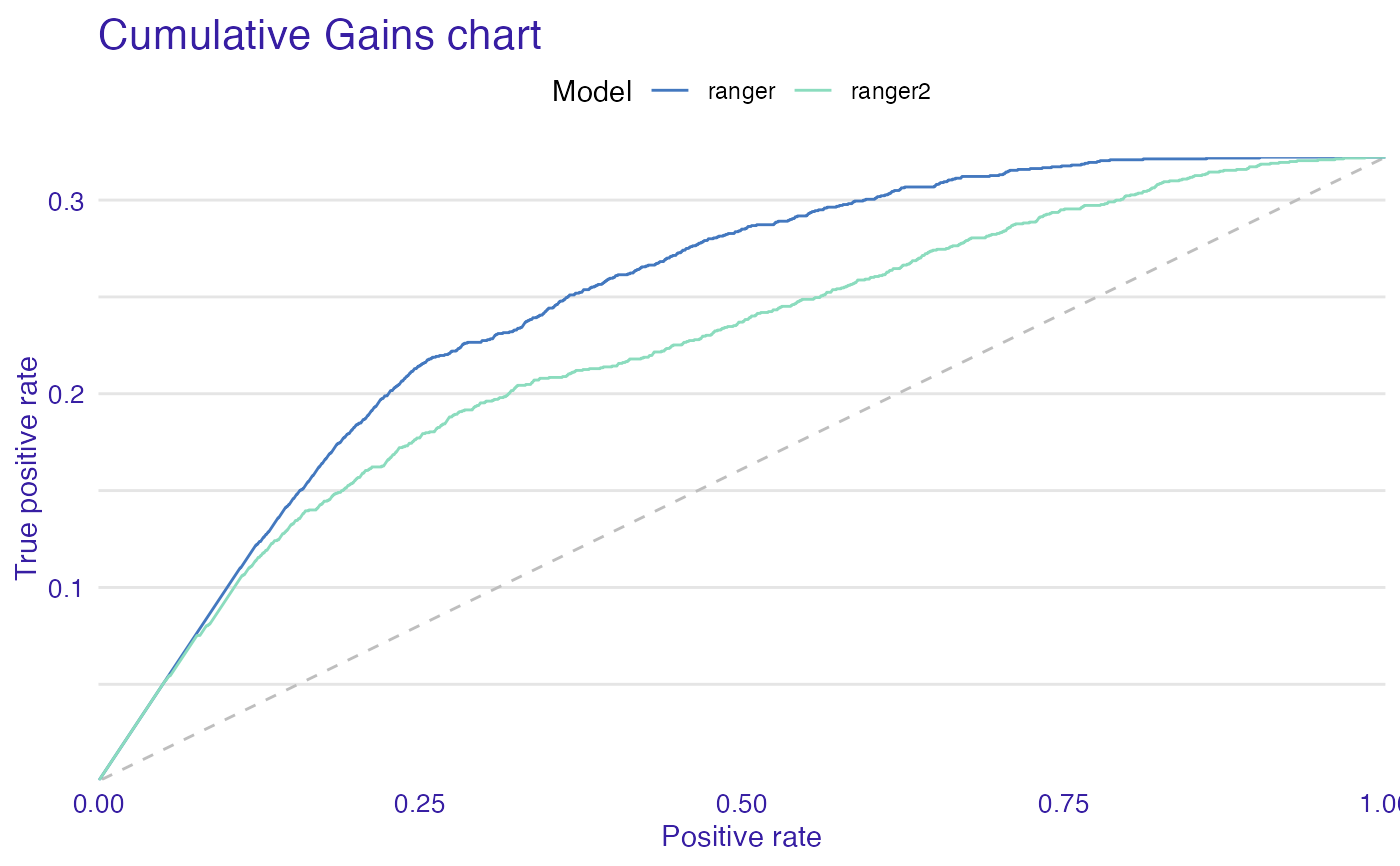
 plot(mp_ranger, mp_ranger2, geom = "gain")
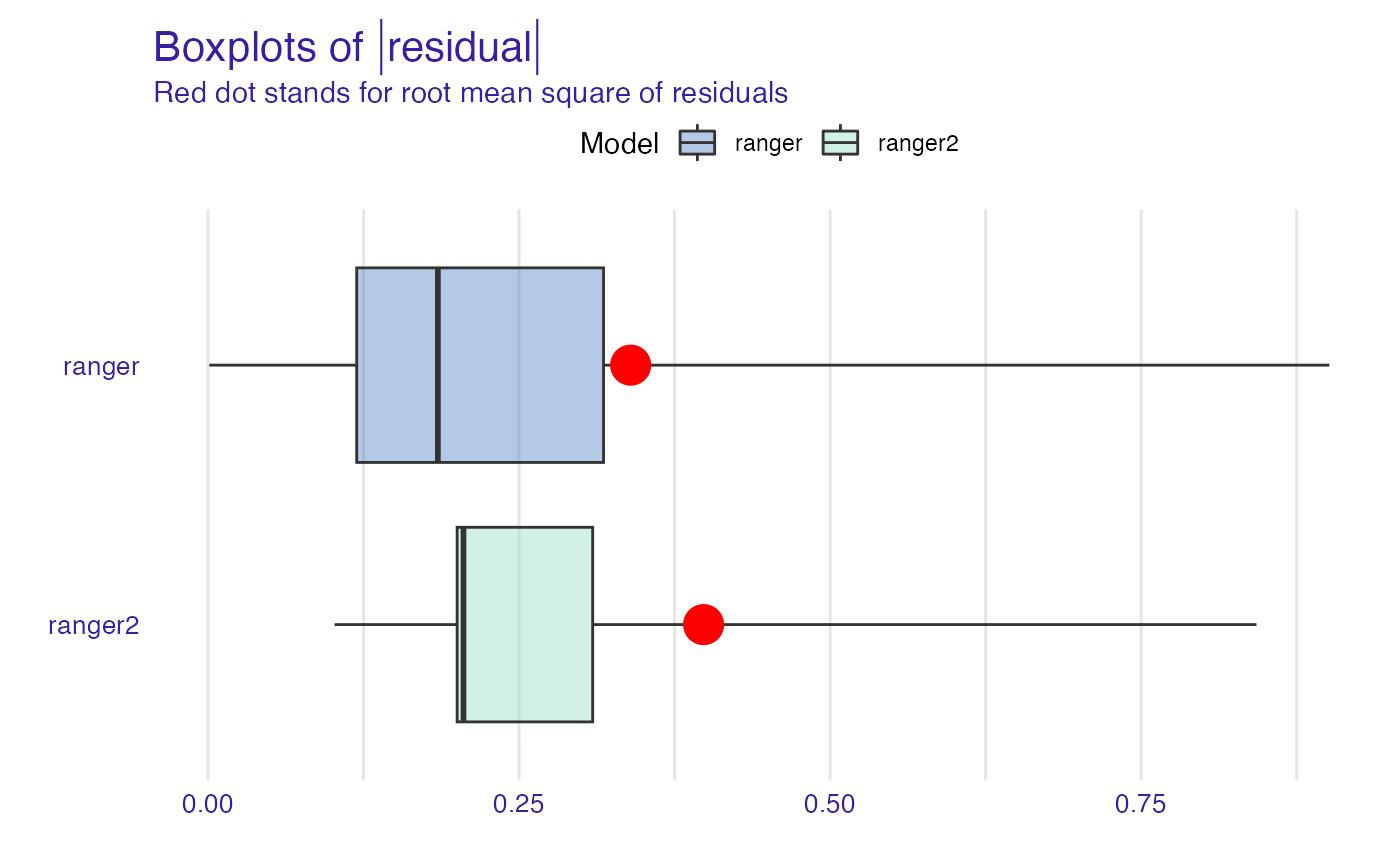
 plot(mp_ranger, mp_ranger2, geom = "boxplot")
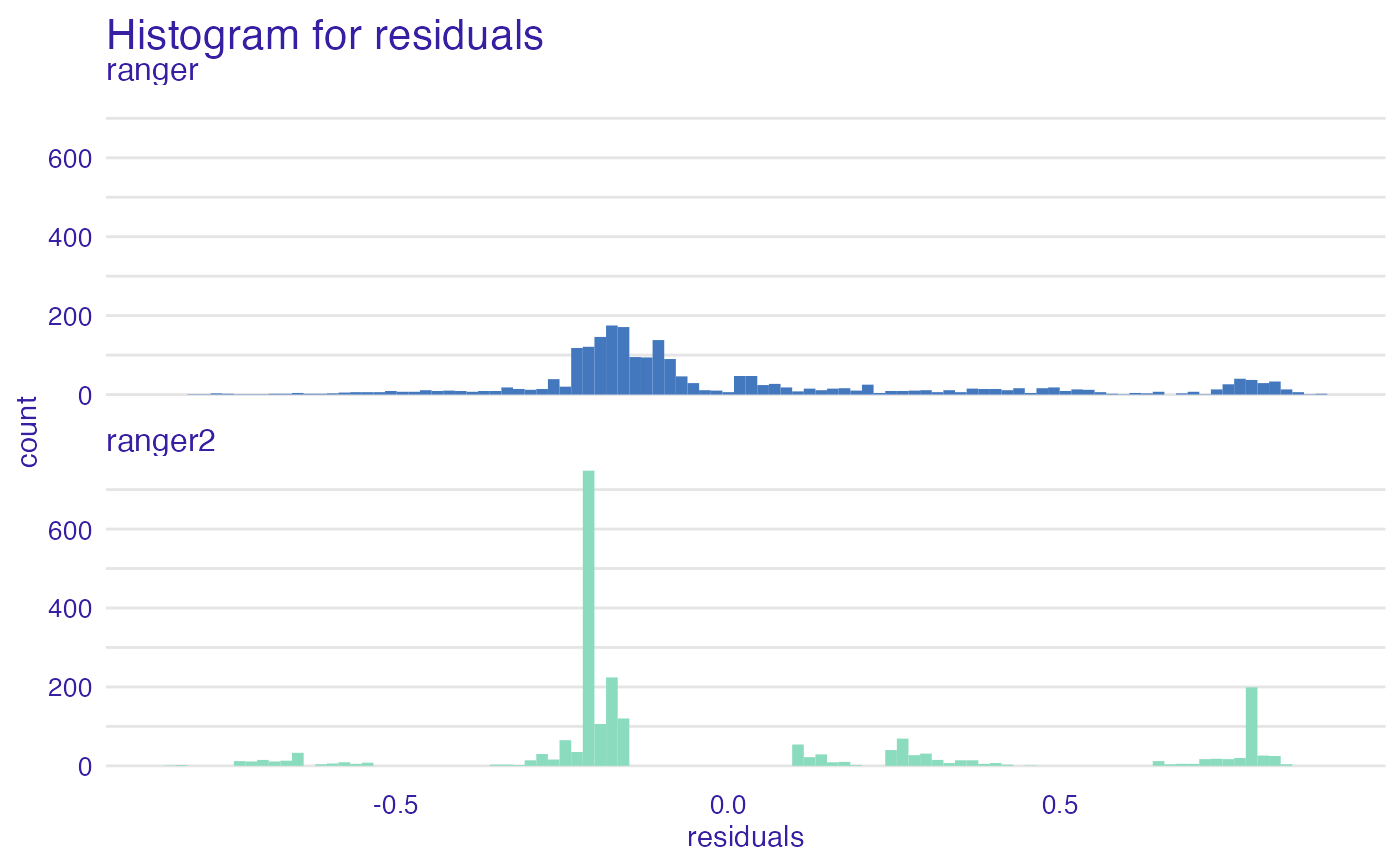
 plot(mp_ranger, mp_ranger2, geom = "histogram")
 plot(mp_ranger, mp_ranger2, geom = "ecdf")
 titanic_glm_model <- glm(survived~., data = titanic_imputed, family = "binomial")
explainer_glm <- explain(titanic_glm_model, data = titanic_imputed[,-8],
y = titanic_imputed$survived, label = "glm",
predict_function = function(m,x) predict.glm(m,x,type = "response"))
#> Preparation of a new explainer is initiated
#> -> model label : glm
#> -> data : 2207 rows 7 cols
#> -> target variable : 2207 values
#> -> predict function : function(m, x) predict.glm(m, x, type = "response")
#> -> predicted values : No value for predict function target column. ( default )
#> -> model_info : package stats , ver. 4.2.3 , task classification ( default )
#> -> predicted values : numerical, min = 0.008128381 , mean = 0.3221568 , max = 0.9731431
#> -> residual function : difference between y and yhat ( default )
#> -> residuals : numerical, min = -0.9628583 , mean = -2.569729e-10 , max = 0.9663346
#> A new explainer has been created!
mp_glm <- model_performance(explainer_glm)
plot(mp_glm)
titanic_glm_model <- glm(survived~., data = titanic_imputed, family = "binomial")
explainer_glm <- explain(titanic_glm_model, data = titanic_imputed[,-8],
y = titanic_imputed$survived, label = "glm",
predict_function = function(m,x) predict.glm(m,x,type = "response"))
#> Preparation of a new explainer is initiated
#> -> model label : glm
#> -> data : 2207 rows 7 cols
#> -> target variable : 2207 values
#> -> predict function : function(m, x) predict.glm(m, x, type = "response")
#> -> predicted values : No value for predict function target column. ( default )
#> -> model_info : package stats , ver. 4.2.3 , task classification ( default )
#> -> predicted values : numerical, min = 0.008128381 , mean = 0.3221568 , max = 0.9731431
#> -> residual function : difference between y and yhat ( default )
#> -> residuals : numerical, min = -0.9628583 , mean = -2.569729e-10 , max = 0.9663346
#> A new explainer has been created!
mp_glm <- model_performance(explainer_glm)
plot(mp_glm)
 titanic_lm_model <- lm(survived~., data = titanic_imputed)
explainer_lm <- explain(titanic_lm_model, data = titanic_imputed[,-8],
y = titanic_imputed$survived, label = "lm")
#> Preparation of a new explainer is initiated
#> -> model label : lm
#> -> data : 2207 rows 7 cols
#> -> target variable : 2207 values
#> -> predict function : yhat.lm will be used ( default )
#> -> predicted values : No value for predict function target column. ( default )
#> -> model_info : package stats , ver. 4.2.3 , task regression ( default )
#> -> predicted values : numerical, min = -0.234433 , mean = 0.3221568 , max = 1.091438
#> -> residual function : difference between y and yhat ( default )
#> -> residuals : numerical, min = -1.045905 , mean = 1.291322e-14 , max = 1.049392
#> A new explainer has been created!
mp_lm <- model_performance(explainer_lm)
plot(mp_lm)
titanic_lm_model <- lm(survived~., data = titanic_imputed)
explainer_lm <- explain(titanic_lm_model, data = titanic_imputed[,-8],
y = titanic_imputed$survived, label = "lm")
#> Preparation of a new explainer is initiated
#> -> model label : lm
#> -> data : 2207 rows 7 cols
#> -> target variable : 2207 values
#> -> predict function : yhat.lm will be used ( default )
#> -> predicted values : No value for predict function target column. ( default )
#> -> model_info : package stats , ver. 4.2.3 , task regression ( default )
#> -> predicted values : numerical, min = -0.234433 , mean = 0.3221568 , max = 1.091438
#> -> residual function : difference between y and yhat ( default )
#> -> residuals : numerical, min = -1.045905 , mean = 1.291322e-14 , max = 1.049392
#> A new explainer has been created!
mp_lm <- model_performance(explainer_lm)
plot(mp_lm)
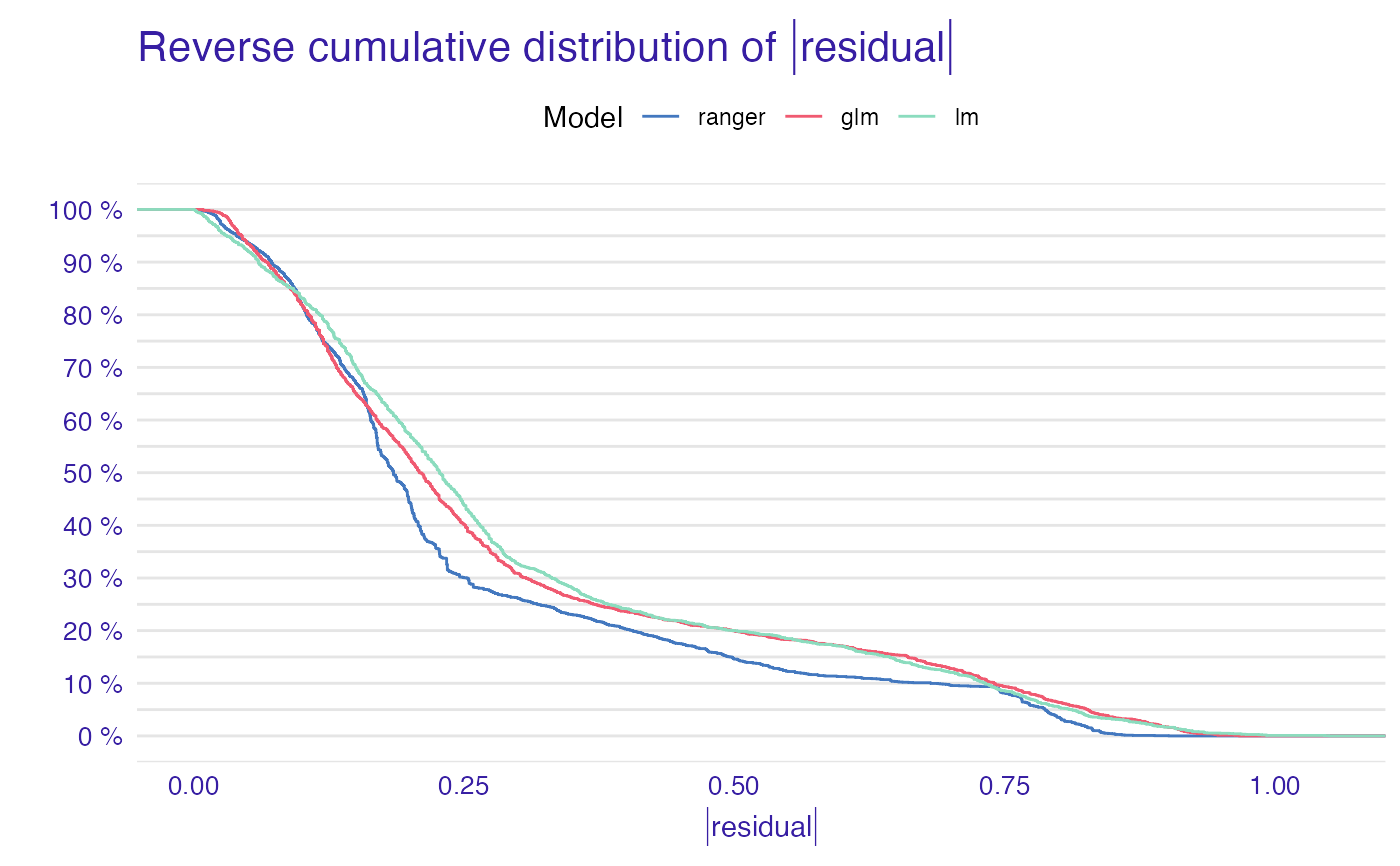
 plot(mp_ranger, mp_glm, mp_lm)
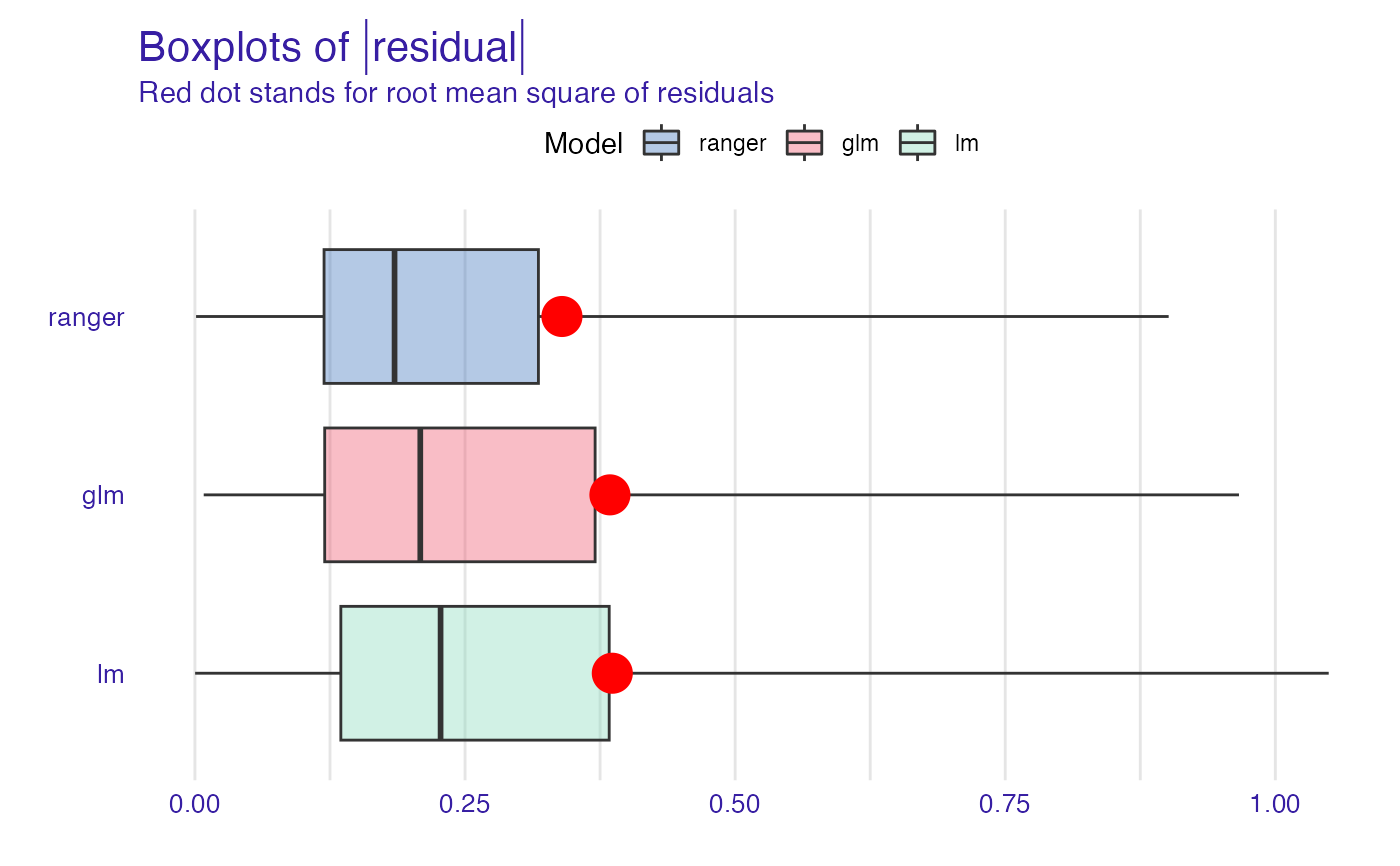
 plot(mp_ranger, mp_glm, mp_lm, geom = "boxplot")
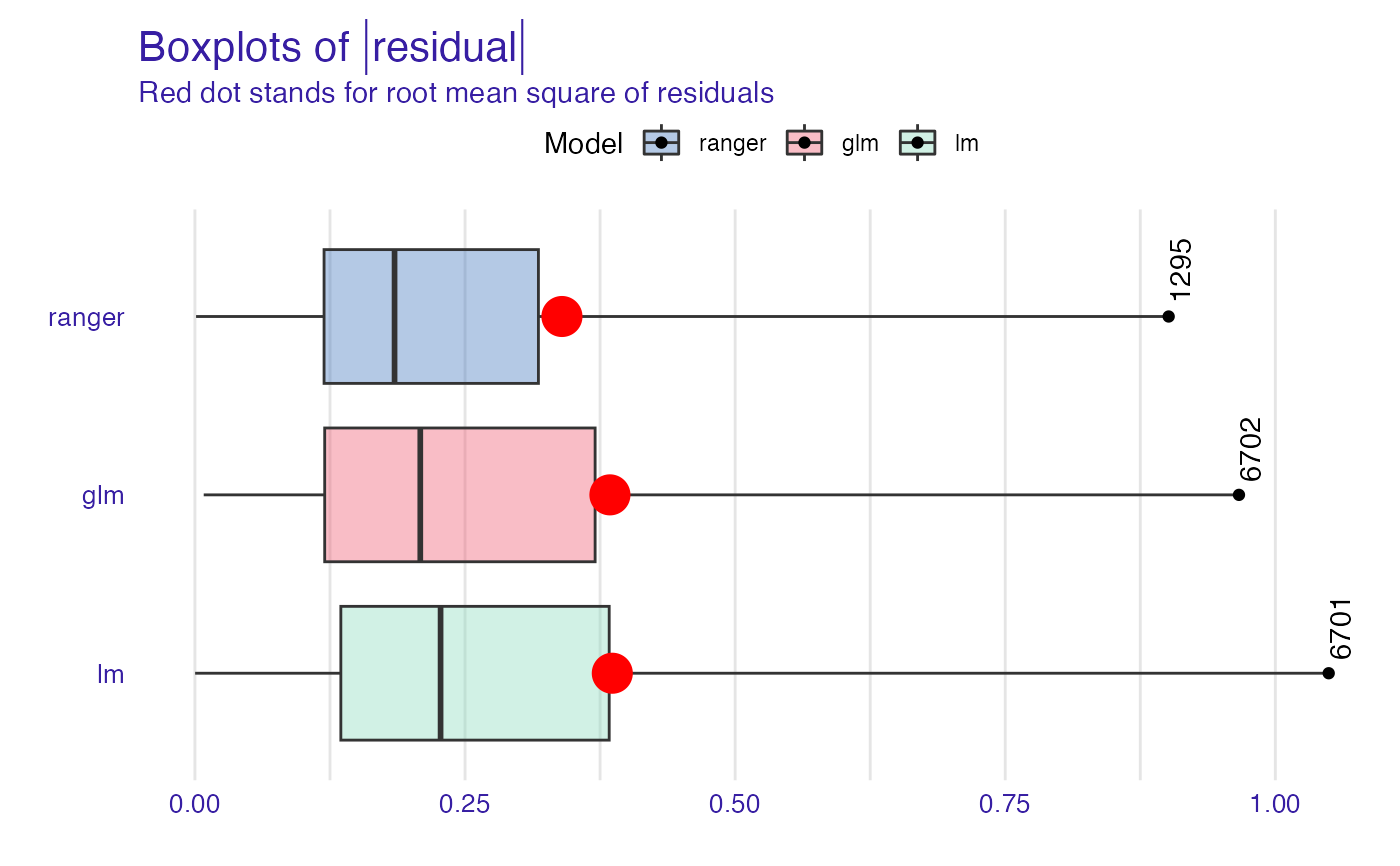
 plot(mp_ranger, mp_glm, mp_lm, geom = "boxplot", show_outliers = 1)
 # }
# }