Creates a waterfall plot of SHAP values of one observation. If multiple observations are selected, their SHAP values and predictions are averaged.
sv_waterfall(object, ...)

# Default S3 method
sv_waterfall(object, ...)

# S3 method for class 'shapviz'
sv_waterfall(
  object,
  row_id = 1L,
  max_display = 10L,
  order_fun = function(s) order(abs(s)),
  fill_colors = c("#f7d13d", "#a52c60"),
  format_shap = getOption("shapviz.format_shap"),
  format_feat = getOption("shapviz.format_feat"),
  contrast = TRUE,
  show_connection = TRUE,
  show_annotation = TRUE,
  annotation_size = 3.2,
  ...
)

# S3 method for class 'mshapviz'
sv_waterfall(
  object,
  row_id = 1L,
  max_display = 10L,
  order_fun = function(s) order(abs(s)),
  fill_colors = c("#f7d13d", "#a52c60"),
  format_shap = getOption("shapviz.format_shap"),
  format_feat = getOption("shapviz.format_feat"),
  contrast = TRUE,
  show_connection = TRUE,
  show_annotation = TRUE,
  annotation_size = 3.2,
  ...
)
Arguments
- object
An object of class "(m)shapviz".
- ...
Arguments passed to
ggfittext::geom_fit_text(). For example,size = 9will use fixed text size in the bars andsize = 0will altogether suppress adding text to the bars.- row_id
Subset of observations to plot, typically a single row number. If more than one row is selected, SHAP values are averaged, and feature values are shown only when they are unique.
- max_display
Maximum number of features (with largest absolute SHAP values) should be plotted? If there are more features, they will be collapsed to one feature. Set to
Infto show all features.- order_fun
Function specifying the order of the variables/SHAP values. It maps the vector
sof SHAP values to sort indices from 1 tolength(s). The default isfunction(s) order(abs(s)). To plot without sorting, usefunction(s) 1:length(s)orfunction(s) length(s):1.- fill_colors
A vector of exactly two fill colors: the first for positive SHAP values, the other for negative ones.
- format_shap
Function used to format SHAP values. The default uses the global option
shapviz.format_shap, which equals tofunction(z) prettyNum(z, digits = 3, scientific = FALSE)by default.- format_feat
Function used to format numeric feature values. The default uses the global option
shapviz.format_feat, which equals tofunction(z) prettyNum(z, digits = 3, scientific = FALSE)by default.- contrast
Logical flag that detemines whether to use white text in dark arrows. Default is
TRUE.- show_connection
Should connecting lines be shown? Default is
TRUE.- show_annotation
Should "f(x)" and "E(f(x))" be plotted? Default is
TRUE.- annotation_size
Size of the annotation text (f(x)=... and E(f(x))=...).
Value
An object of class "ggplot" (or "patchwork") representing a waterfall plot.
Details
f(x) denotes the prediction on the SHAP scale, while E(f(x)) refers to the baseline SHAP value.
Methods (by class)
sv_waterfall(default): Default method.sv_waterfall(shapviz): SHAP waterfall plot for an object of class "shapviz".sv_waterfall(mshapviz): SHAP waterfall plot for an object of class "mshapviz".
See also
Examples
dtrain <- xgboost::xgb.DMatrix(
data.matrix(iris[, -1]),
label = iris[, 1], nthread = 1
)
fit <- xgboost::xgb.train(data = dtrain, nrounds = 20, nthread = 1)
x <- shapviz(fit, X_pred = dtrain, X = iris[, -1])
sv_waterfall(x)
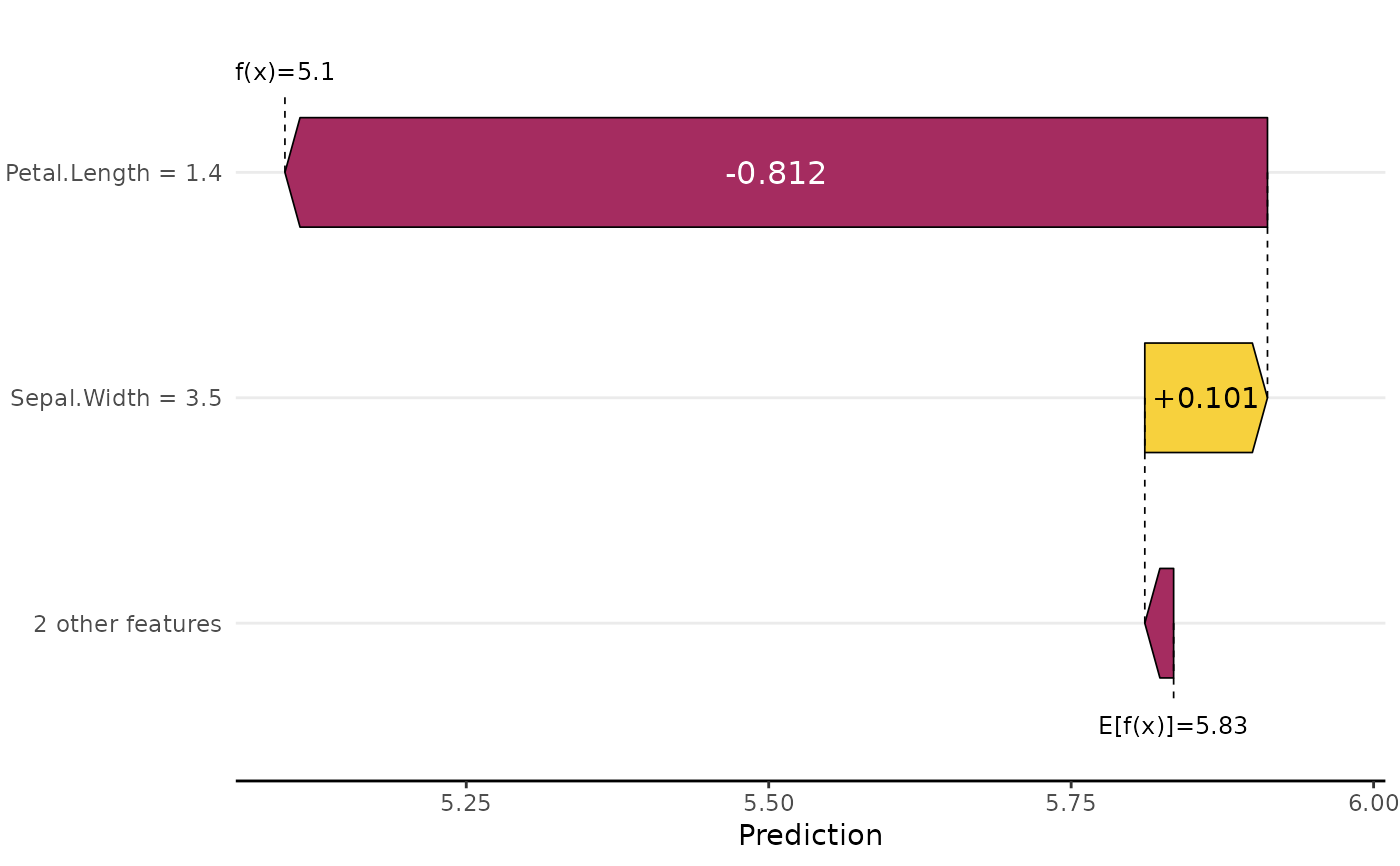
 sv_waterfall(x, row_id = 123, max_display = 2, size = 9, fill_colors = 4:5)
 # Ordered by colnames(x), combined with max_display
sv_waterfall(
x[, sort(colnames(x))],
order_fun = function(s) length(s):1, max_display = 3
)
# Ordered by colnames(x), combined with max_display
sv_waterfall(
x[, sort(colnames(x))],
order_fun = function(s) length(s):1, max_display = 3
)
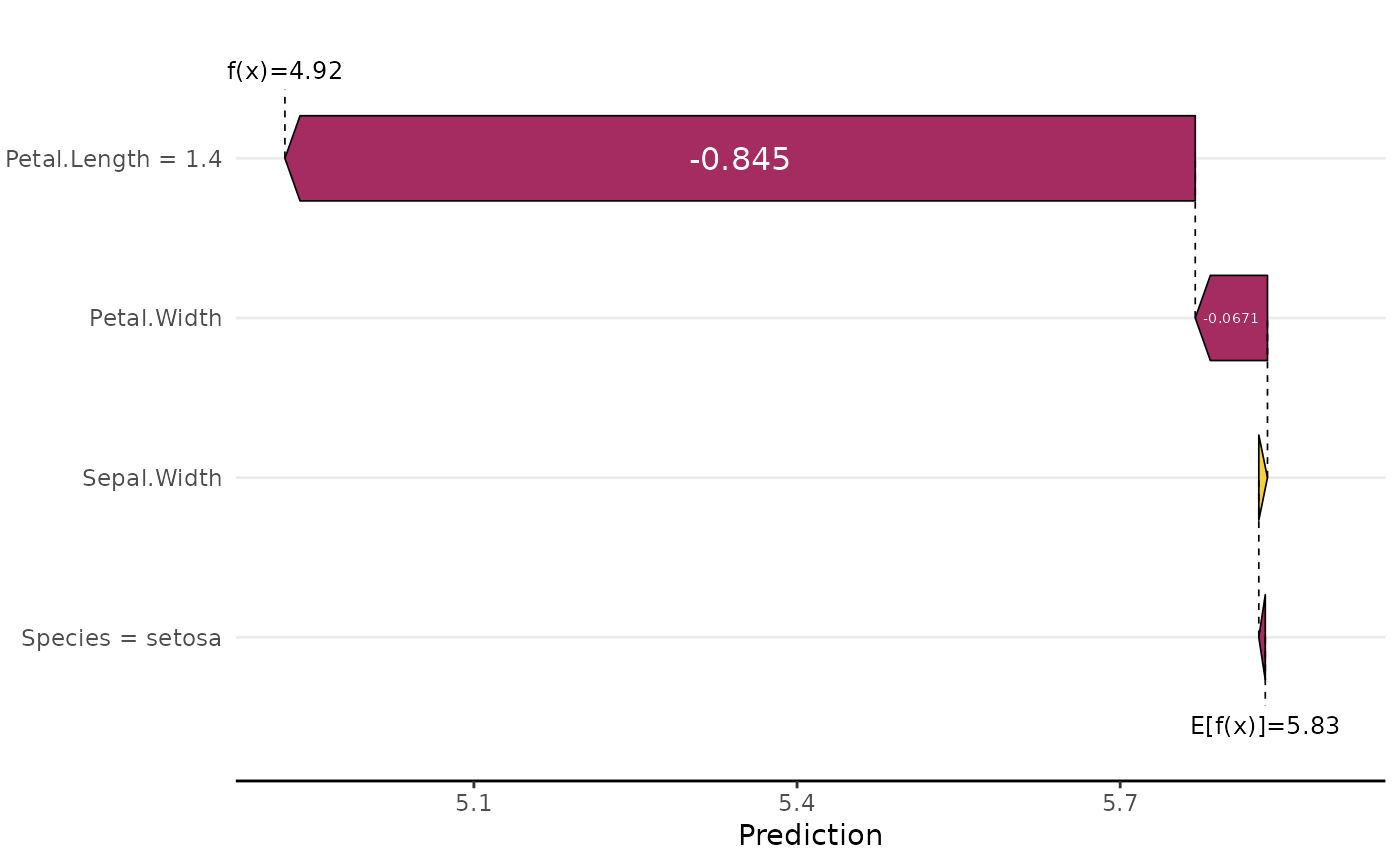
 # Aggregate over all observations with Petal.Length == 1.4
sv_waterfall(x, row_id = x$X$Petal.Length == 1.4)
#> Aggregating SHAP values over 13 observations
# Aggregate over all observations with Petal.Length == 1.4
sv_waterfall(x, row_id = x$X$Petal.Length == 1.4)
#> Aggregating SHAP values over 13 observations
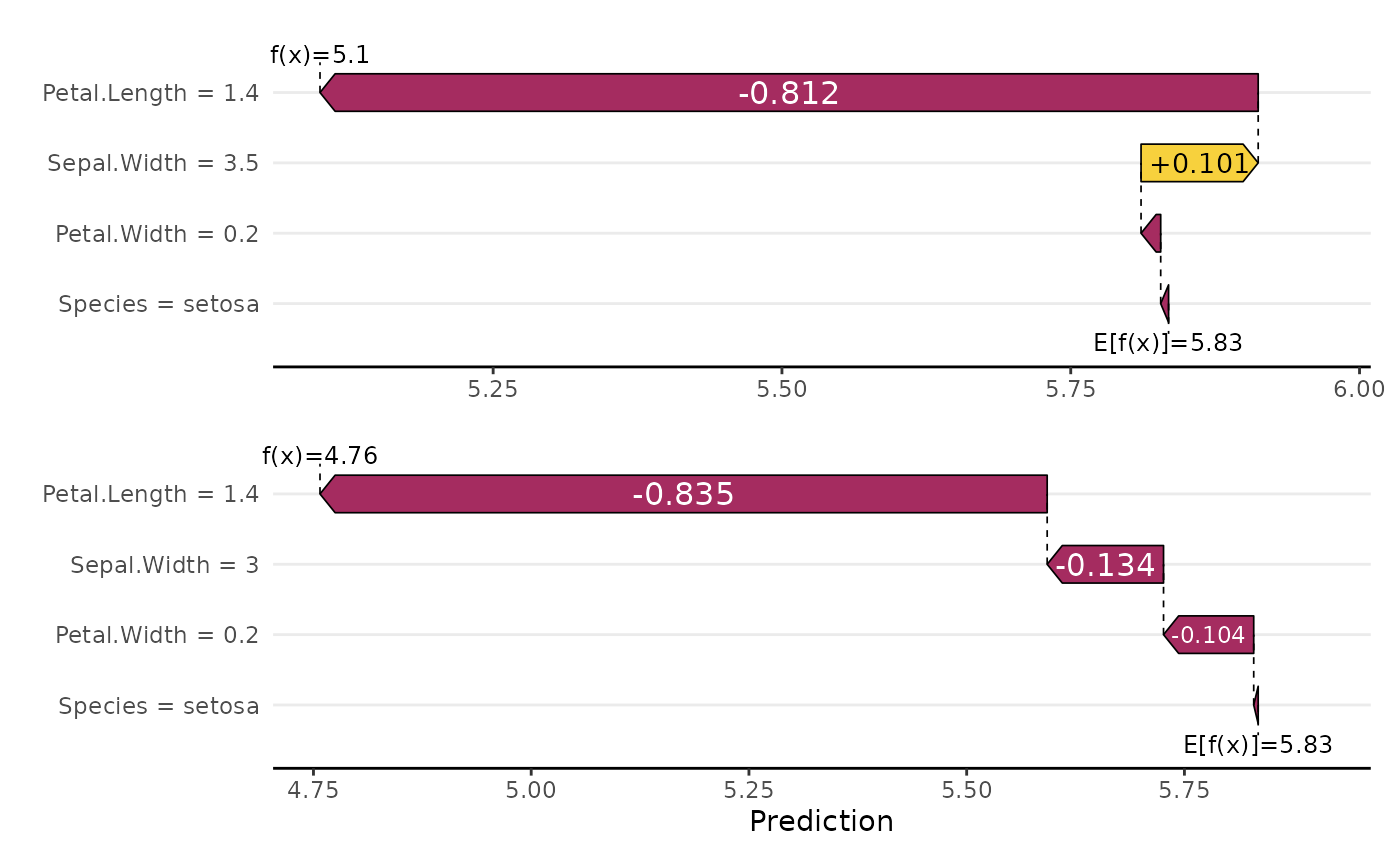
 # Two observations separately
sv_waterfall(c(x[1, ], x[2, ])) +
patchwork::plot_layout(ncol = 1)
# Two observations separately
sv_waterfall(c(x[1, ], x[2, ])) +
patchwork::plot_layout(ncol = 1)