Creates a beeswarm plot or a barplot of SHAP interaction values/main effects.
In the beeswarm plot (kind = "beeswarm"), diagonals represent the main effects,
while off-diagonals show SHAP interactions (multiplied by two due to symmetry).
The color axis represent min-max scaled feature values.
Non-numeric features are transformed to numeric by calling data.matrix() first.
The features are sorted in decreasing order of usual SHAP importance.
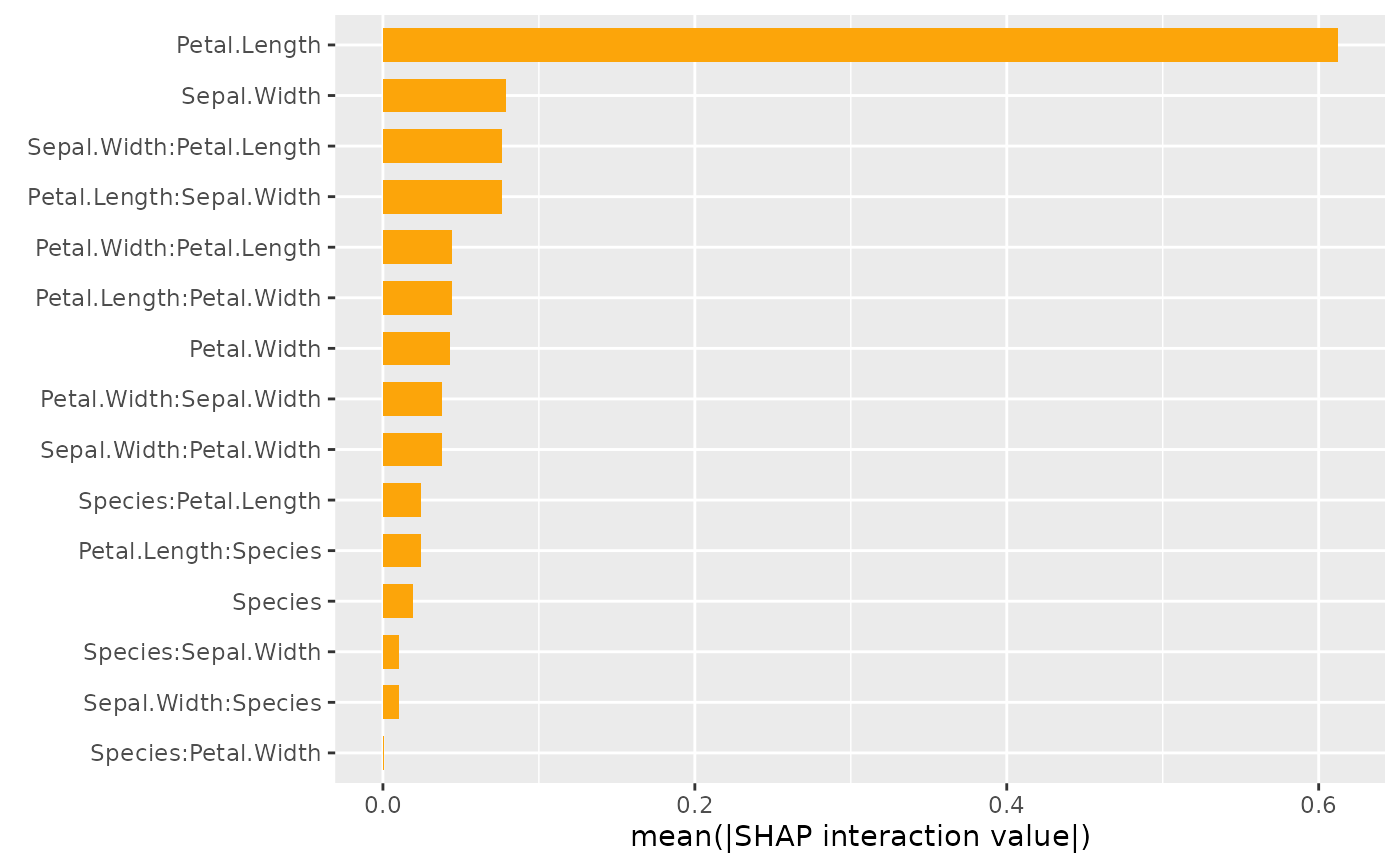
The barplot (kind = "bar") shows average absolute SHAP interaction values
and main effects for each feature pair.
Again, due to symmetry, the interaction values are multiplied by two.
sv_interaction(object, ...)

# Default S3 method
sv_interaction(object, ...)

# S3 method for class 'shapviz'
sv_interaction(
  object,
  kind = c("beeswarm", "bar", "no"),
  max_display = 15L - 8 * (kind == "beeswarm"),
  alpha = 0.3,
  bee_width = 0.3,
  bee_adjust = 0.5,
  viridis_args = getOption("shapviz.viridis_args"),
  color_bar_title = "Row feature value",
  sort_features = TRUE,
  fill = "#fca50a",
  bar_width = 2/3,
  ...
)

# S3 method for class 'mshapviz'
sv_interaction(
  object,
  kind = c("beeswarm", "bar", "no"),
  max_display = 7L,
  alpha = 0.3,
  bee_width = 0.3,
  bee_adjust = 0.5,
  viridis_args = getOption("shapviz.viridis_args"),
  color_bar_title = "Row feature value",
  sort_features = TRUE,
  fill = "#fca50a",
  bar_width = 2/3,
  ...
)
Arguments
- object
An object of class "(m)shapviz" containing element
S_inter.- ...
Arguments passed to
ggplot2::geom_point(). For instance, passingsize = 1will produce smaller dots.- kind
Set to "no" to return the matrix of average absolute SHAP interactions (or a list of such matrices in case of object of class "mshapviz"). Due to symmetry, off-diagonals are multiplied by two. The default is "beeswarm".
- max_display
How many features should be plotted? Set to
Infto show all features. Has no effect ifkind = "no".- alpha
Transparency of the beeswarm dots. Defaults to 0.3.
- bee_width
Relative width of the beeswarms.
- bee_adjust
Relative bandwidth adjustment factor used in estimating the density of the beeswarms.
- viridis_args
List of viridis color scale arguments. The default points to the global option
shapviz.viridis_args, which corresponds tolist(begin = 0.25, end = 0.85, option = "inferno"). These values are passed toggplot2::scale_color_viridis_c(). For example, to switch to standard viridis, either change the default withoptions(shapviz.viridis_args = list())or setviridis_args = list().- color_bar_title
Title of color bar of the beeswarm plot. Set to
NULLto hide the color bar altogether.- sort_features
Should features be sorted or not? The default is
TRUE.- fill
Color used to fill the bars (only used if bars are shown).
- bar_width
Relative width of the bars (only used if bars are shown).
Value
A "ggplot" (or "patchwork") object, or - if kind = "no" - a named
numeric matrix of average absolute SHAP interactions sorted by the average
absolute SHAP values (or a list of such matrices in case of "mshapviz" object).
Methods (by class)
sv_interaction(default): Default method.sv_interaction(shapviz): SHAP interaction plot for an object of class "shapviz".sv_interaction(mshapviz): SHAP interaction plot for an object of class "mshapviz".
See also
Examples
dtrain <- xgboost::xgb.DMatrix(
  data.matrix(iris[, -1]),
  label = iris[, 1], nthread = 1
)
fit <- xgboost::xgb.train(data = dtrain, nrounds = 10, nthread = 1)
x <- shapviz(fit, X_pred = dtrain, X = iris, interactions = TRUE)
sv_interaction(x, kind = "no")
#>              Petal.Length Sepal.Width  Petal.Width      Species
#> Petal.Length   0.61216324  0.07647426 0.0439800712 0.0241938755
#> Sepal.Width    0.07647426  0.07895533 0.0381466589 0.0103276313
#> Petal.Width    0.04398007  0.03814666 0.0428673263 0.0006772994
#> Species        0.02419388  0.01032763 0.0006772994 0.0190167296
sv_interaction(x, max_display = 2, size = 3)

sv_interaction(x, kind = "bar")