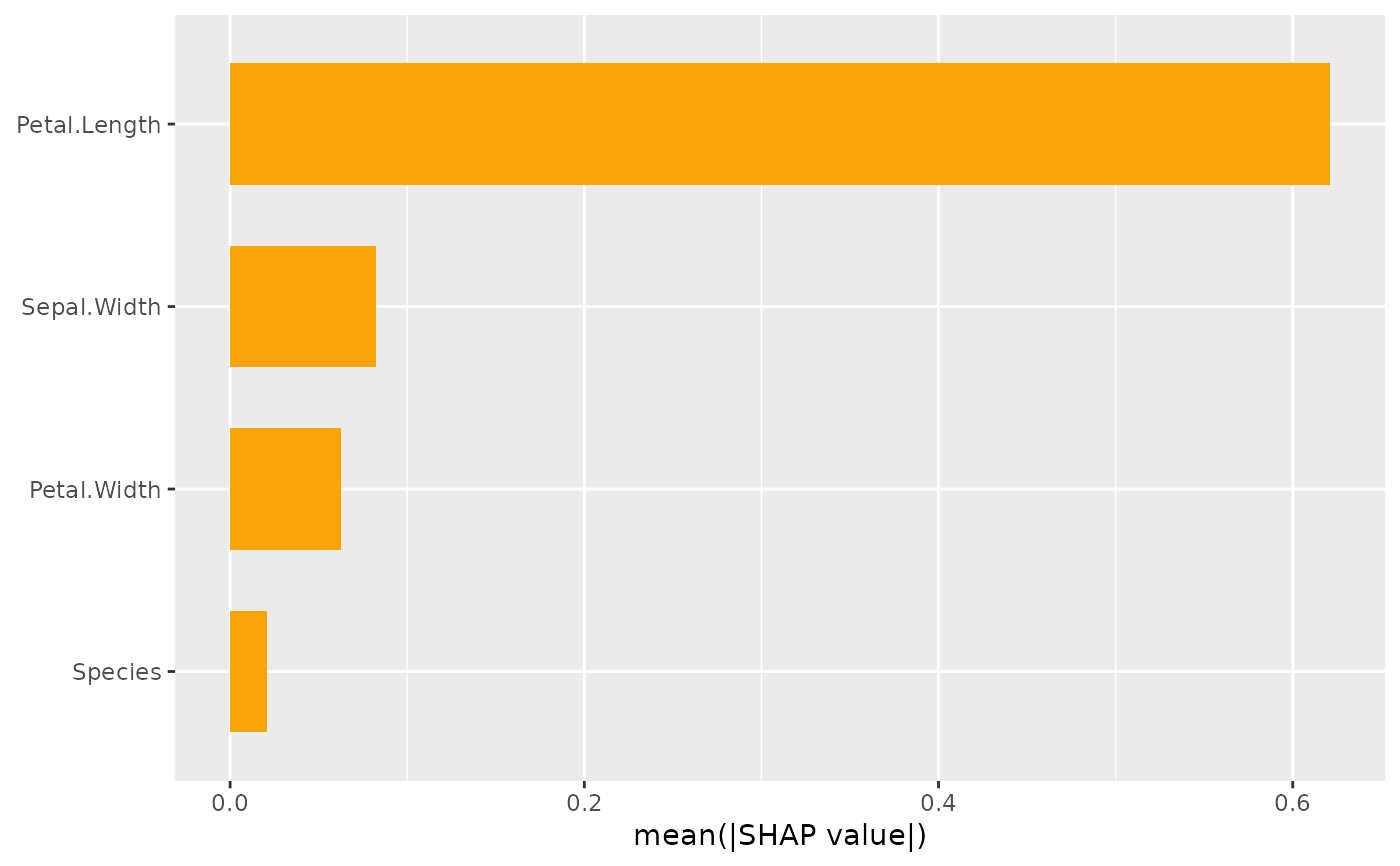
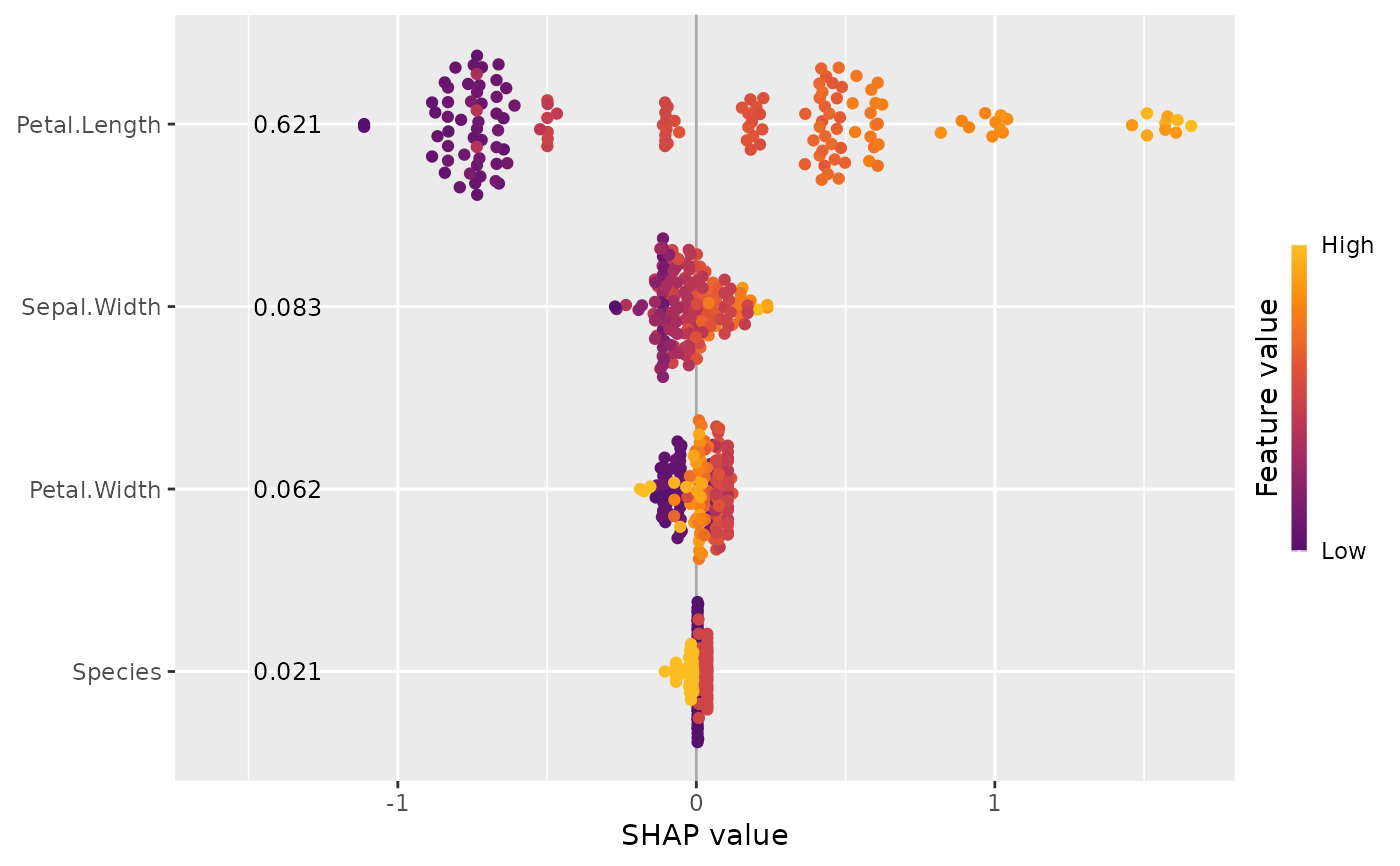
This function provides two types of SHAP importance plots: a bar plot and a beeswarm plot (sometimes called "SHAP summary plot"). The two types of plots can also be combined.
sv_importance(object, ...)

# Default S3 method
sv_importance(object, ...)

# S3 method for class 'shapviz'
sv_importance(
  object,
  kind = c("bar", "beeswarm", "both", "no"),
  max_display = 15L,
  fill = "#fca50a",
  bar_width = 2/3,
  bee_width = 0.4,
  bee_adjust = 0.5,
  viridis_args = getOption("shapviz.viridis_args"),
  color_bar_title = "Feature value",
  show_numbers = FALSE,
  format_fun = format_max,
  number_size = 3.2,
  sort_features = TRUE,
  ...
)

# S3 method for class 'mshapviz'
sv_importance(
  object,
  kind = c("bar", "beeswarm", "both", "no"),
  max_display = 15L,
  fill = "#fca50a",
  bar_width = 2/3,
  bar_type = c("dodge", "stack", "facets", "separate"),
  bee_width = 0.4,
  bee_adjust = 0.5,
  viridis_args = getOption("shapviz.viridis_args"),
  color_bar_title = "Feature value",
  show_numbers = FALSE,
  format_fun = format_max,
  number_size = 3.2,
  sort_features = TRUE,
  ...
)
Arguments
- object
An object of class "(m)shapviz".
- ...
Arguments passed to
ggplot2::geom_bar()(ifkind = "bar") or toggplot2::geom_point()otherwise. For instance, passingalpha = 0.2will produce semi-transparent beeswarms, and settingsize = 3will produce larger dots.- kind
Should a "bar" plot (the default), a "beeswarm" plot, or "both" be shown? Set to "no" in order to suppress plotting. In that case, the sorted SHAP feature importances of all variables are returned.
- max_display
How many features should be plotted? Set to
Infto show all features. Has no effect ifkind = "no".- fill
Color used to fill the bars (only used if bars are shown).
- bar_width
Relative width of the bars (only used if bars are shown).
- bee_width
Relative width of the beeswarms.
- bee_adjust
Relative bandwidth adjustment factor used in estimating the density of the beeswarms.
- viridis_args
List of viridis color scale arguments. The default points to the global option
shapviz.viridis_args, which corresponds tolist(begin = 0.25, end = 0.85, option = "inferno"). These values are passed toggplot2::scale_color_viridis_c(). For example, to switch to standard viridis, either change the default withoptions(shapviz.viridis_args = list())or setviridis_args = list().- color_bar_title
Title of color bar of the beeswarm plot. Set to
NULLto hide the color bar altogether.- show_numbers
Should SHAP feature importances be printed? Default is
FALSE.- format_fun
Function used to format SHAP feature importances (only if
show_numbers = TRUE). To change to scientific notation, usefunction(x) = prettyNum(x, scientific = TRUE).- number_size
Text size of the numbers (if
show_numbers = TRUE).- sort_features
Should features be sorted or not? The default is
TRUE.- bar_type
For "mshapviz" objects with
kind = "bar": How should bars be represented? The default is "dodge" for dodged bars. Other options are "stack", "wrap", or "separate" (via "patchwork"). Note that "separate" is currently the only option that supportsshow_numbers = TRUE.
Value
A "ggplot" (or "patchwork") object representing an importance plot, or - if
kind = "no" - a named numeric vector of sorted SHAP feature importances
(or a matrix in case of an object of class "mshapviz").
Details
The bar plot shows SHAP feature importances, calculated as the average absolute SHAP
value per feature. The beeswarm plot displays SHAP values per feature, using min-max
scaled feature values on the color axis. Non-numeric features are transformed
to numeric by calling data.matrix() first. For both types of plots, the features
are sorted in decreasing order of importance.
Methods (by class)
sv_importance(default): Default method.sv_importance(shapviz): SHAP importance plot for an object of class "shapviz".sv_importance(mshapviz): SHAP importance plot for an object of class "mshapviz".
See also
Examples
X_train <- data.matrix(iris[, -1])
dtrain <- xgboost::xgb.DMatrix(X_train, label = iris[, 1], nthread = 1)
fit <- xgboost::xgb.train(data = dtrain, nrounds = 10, nthread = 1)
x <- shapviz(fit, X_pred = X_train)
sv_importance(x)

sv_importance(x, kind = "no")
#> Petal.Length  Sepal.Width  Petal.Width      Species
#>   0.62123659   0.08254966   0.06248401   0.02103343
sv_importance(x, kind = "beeswarm", show_numbers = TRUE)
