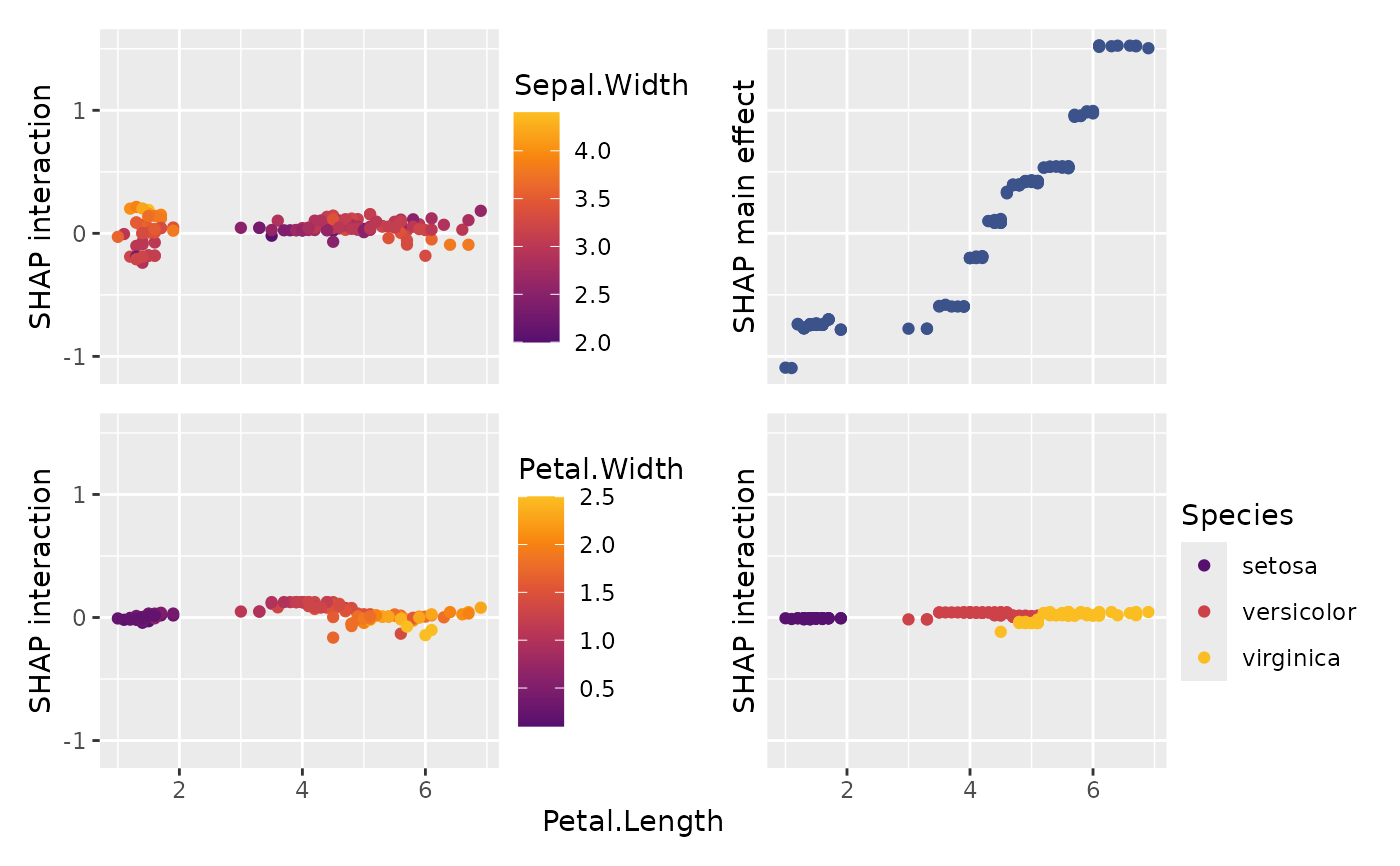
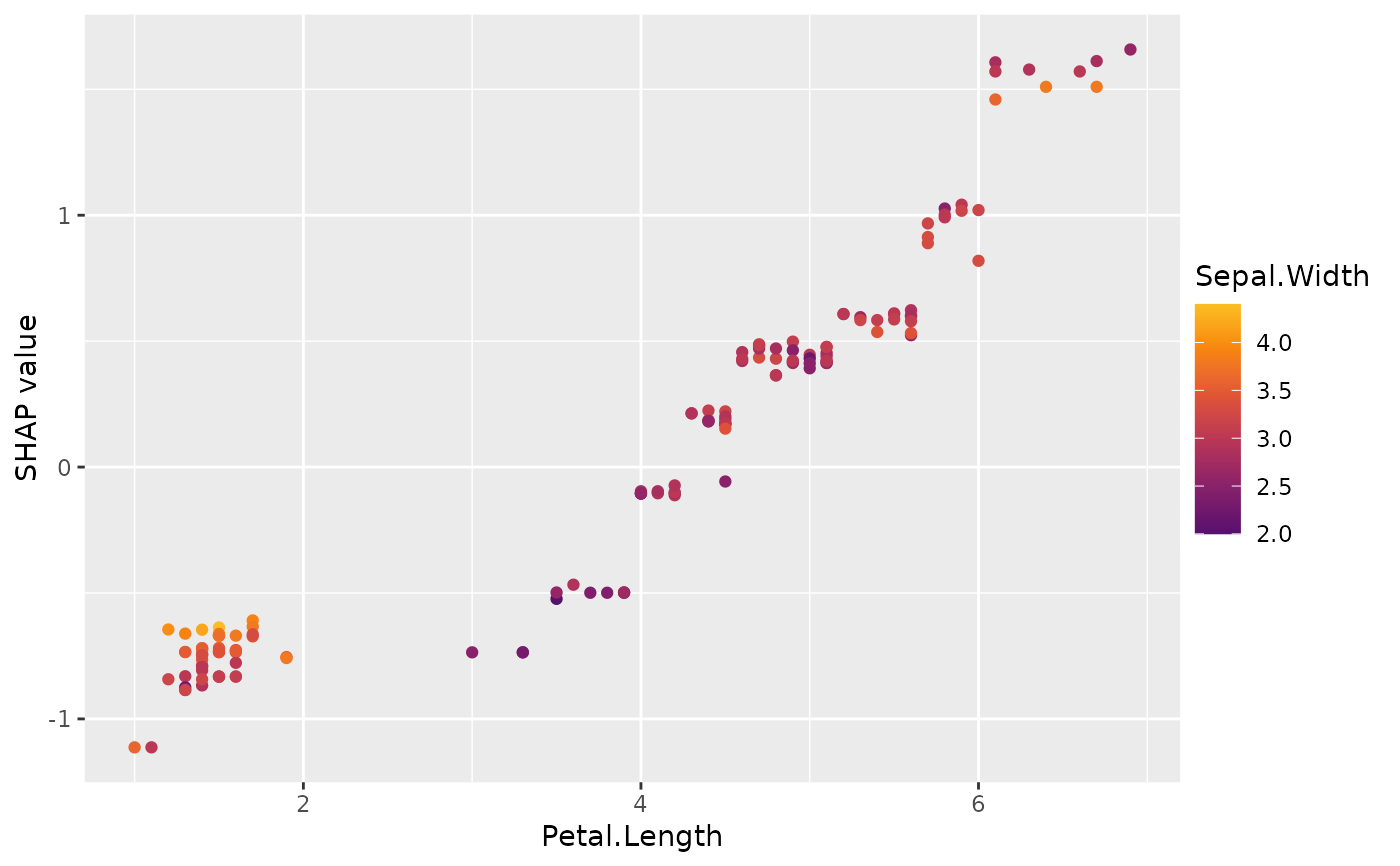
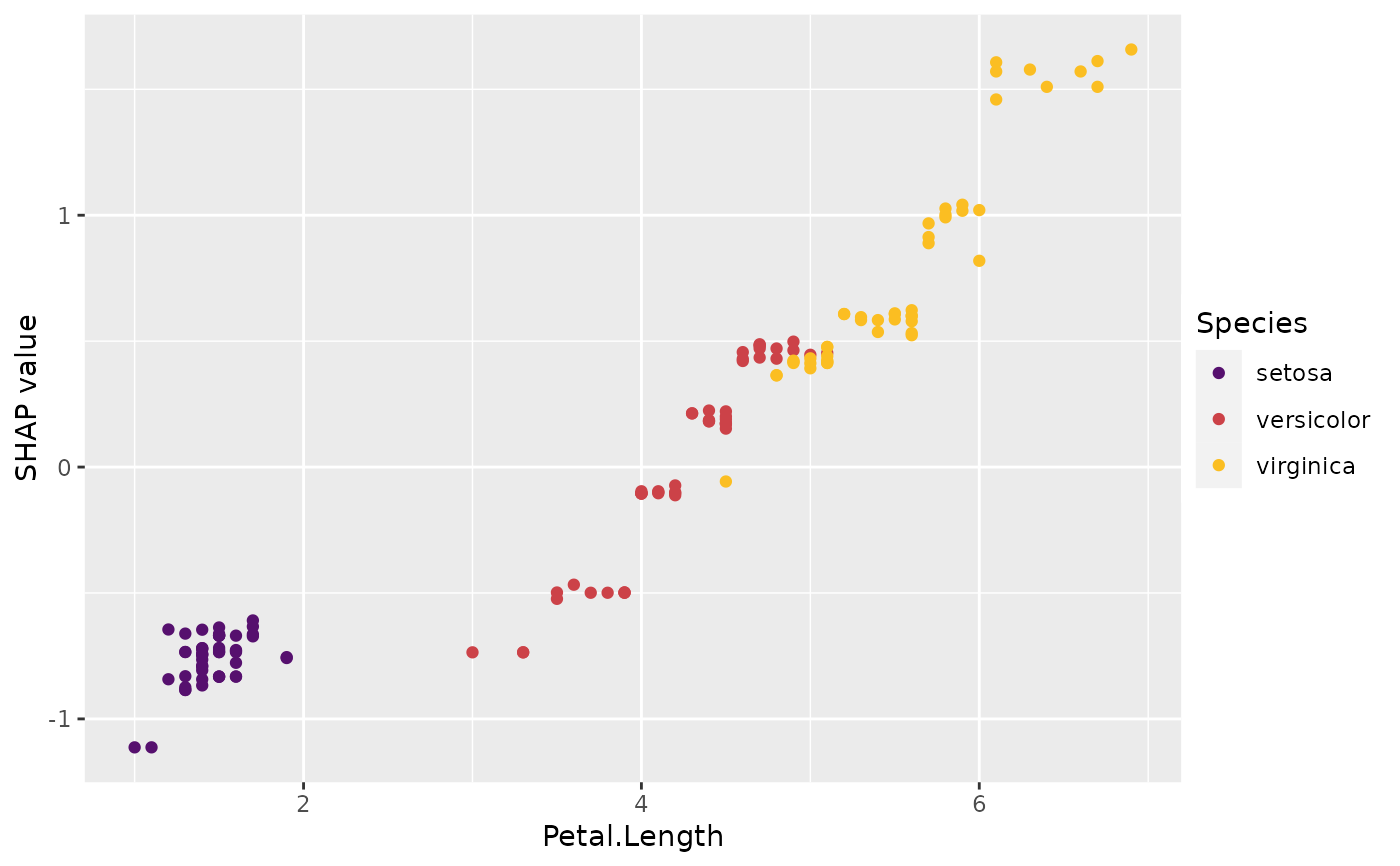
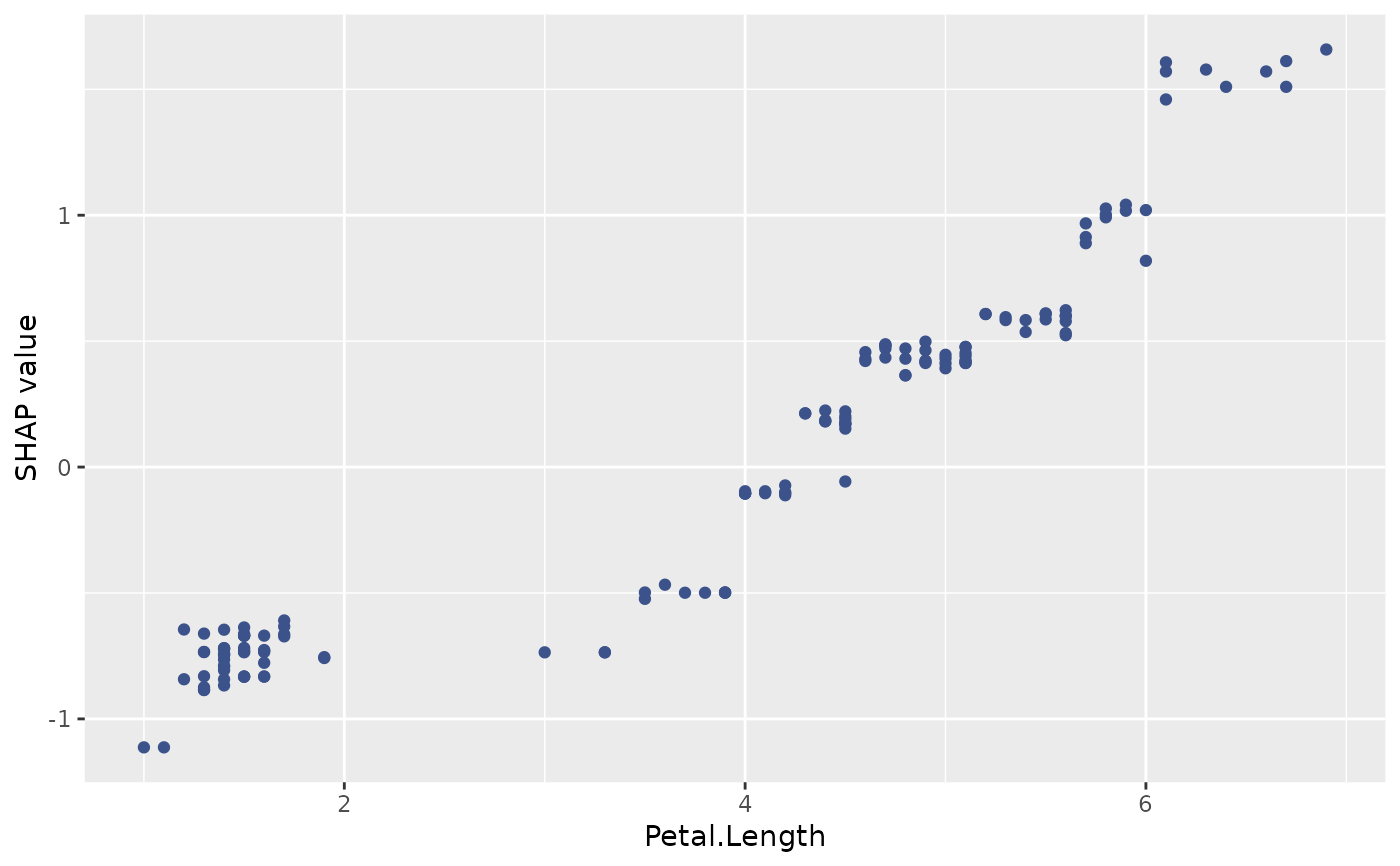
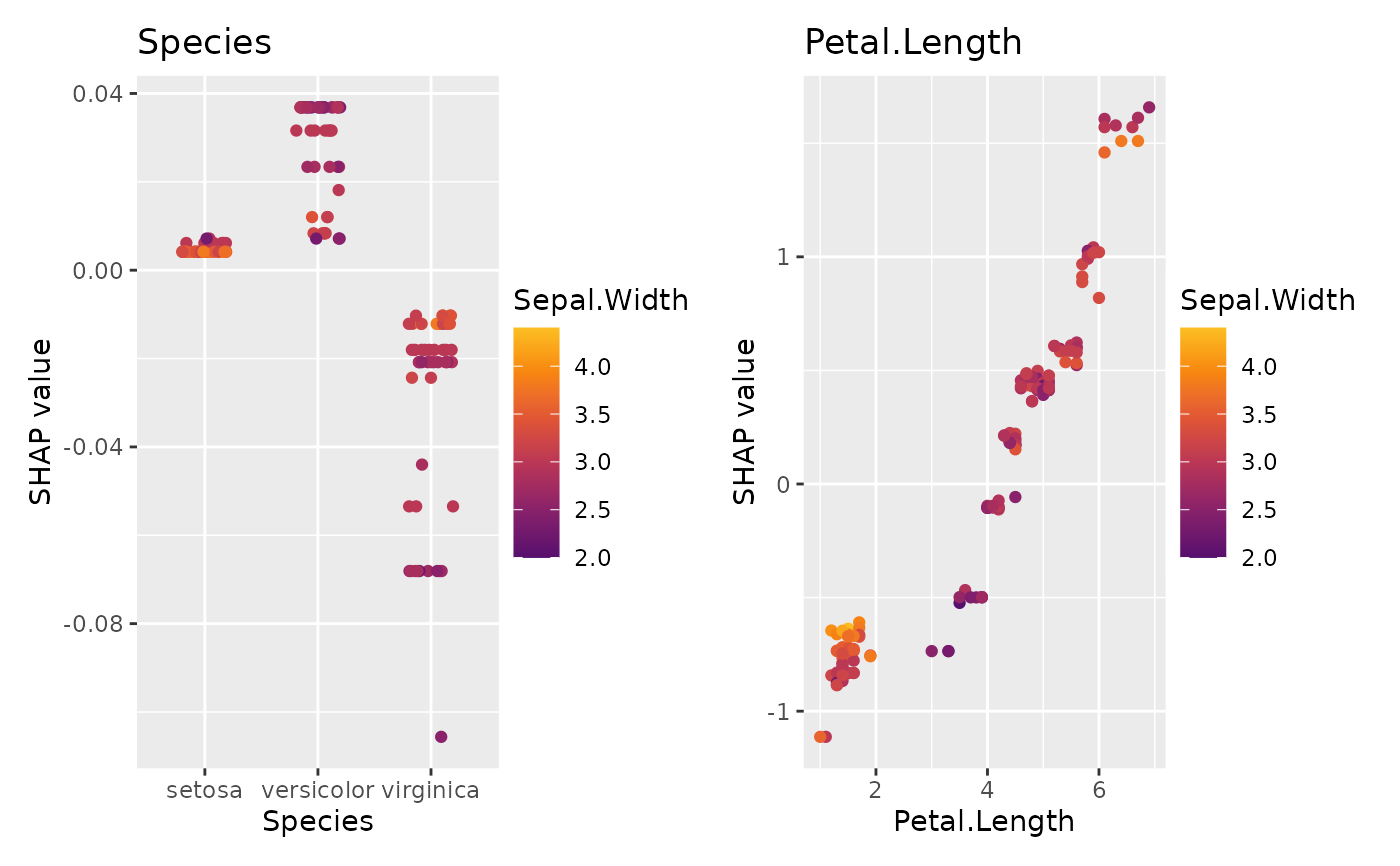
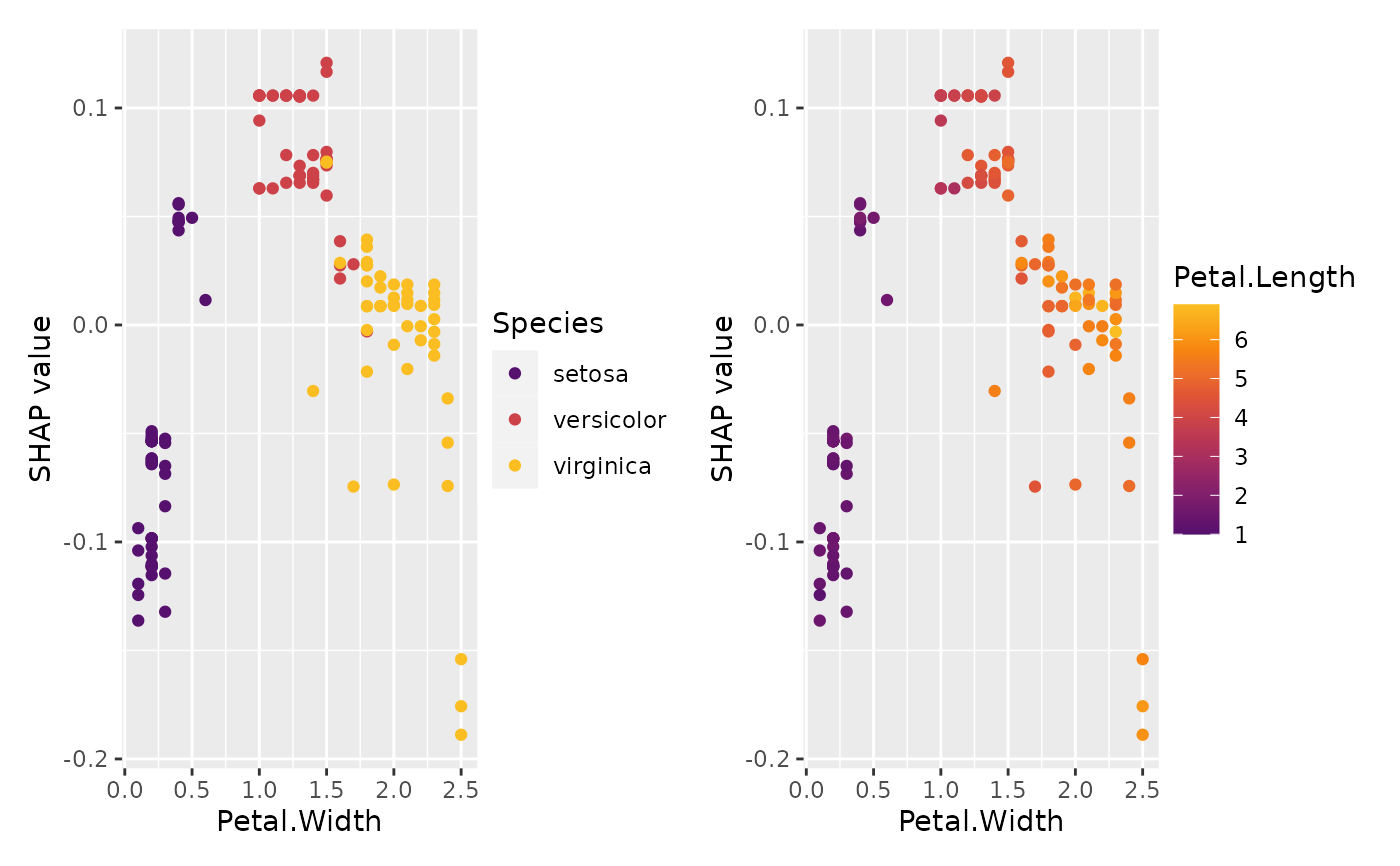
Scatterplot of the SHAP values of a feature against its feature values.
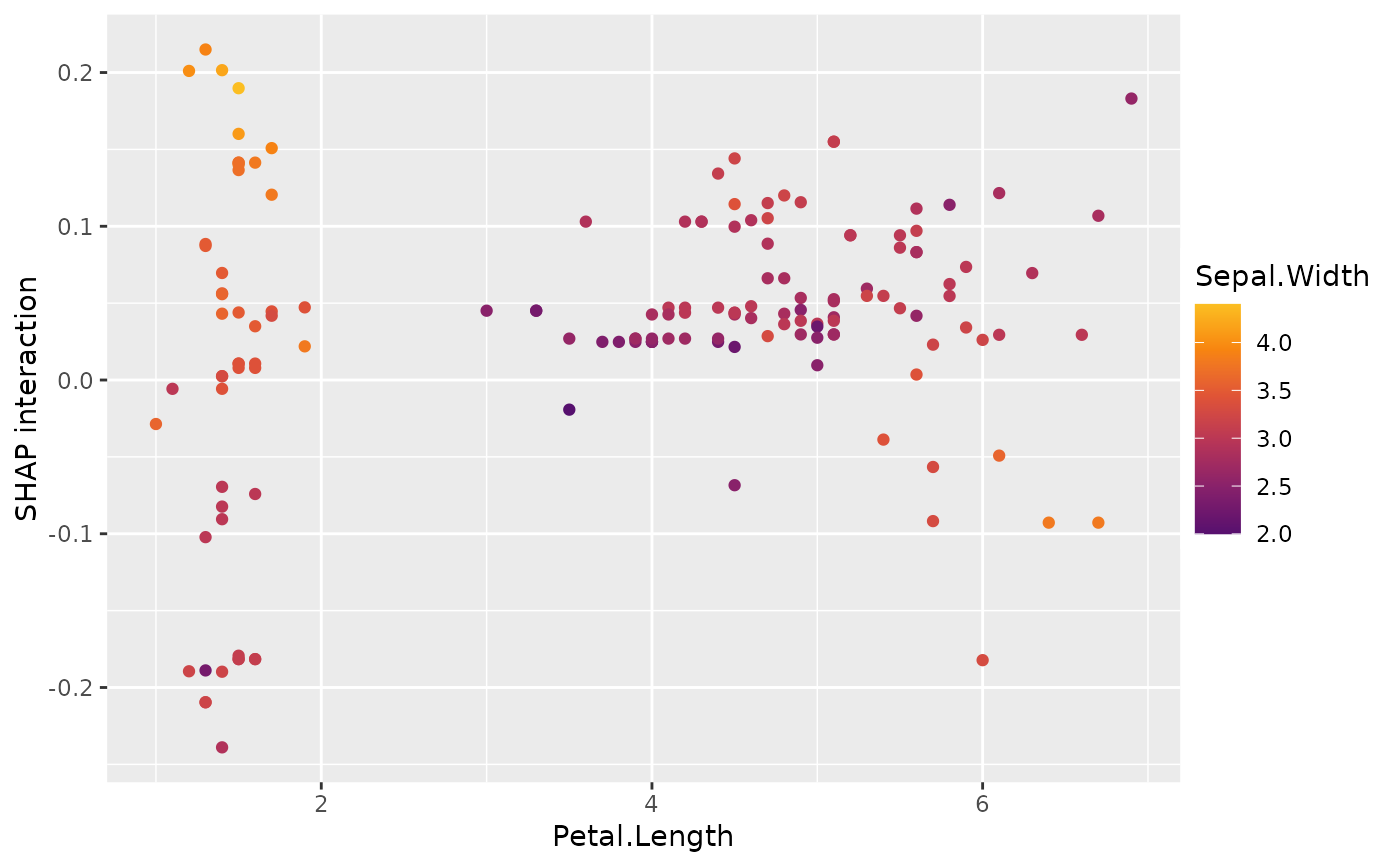
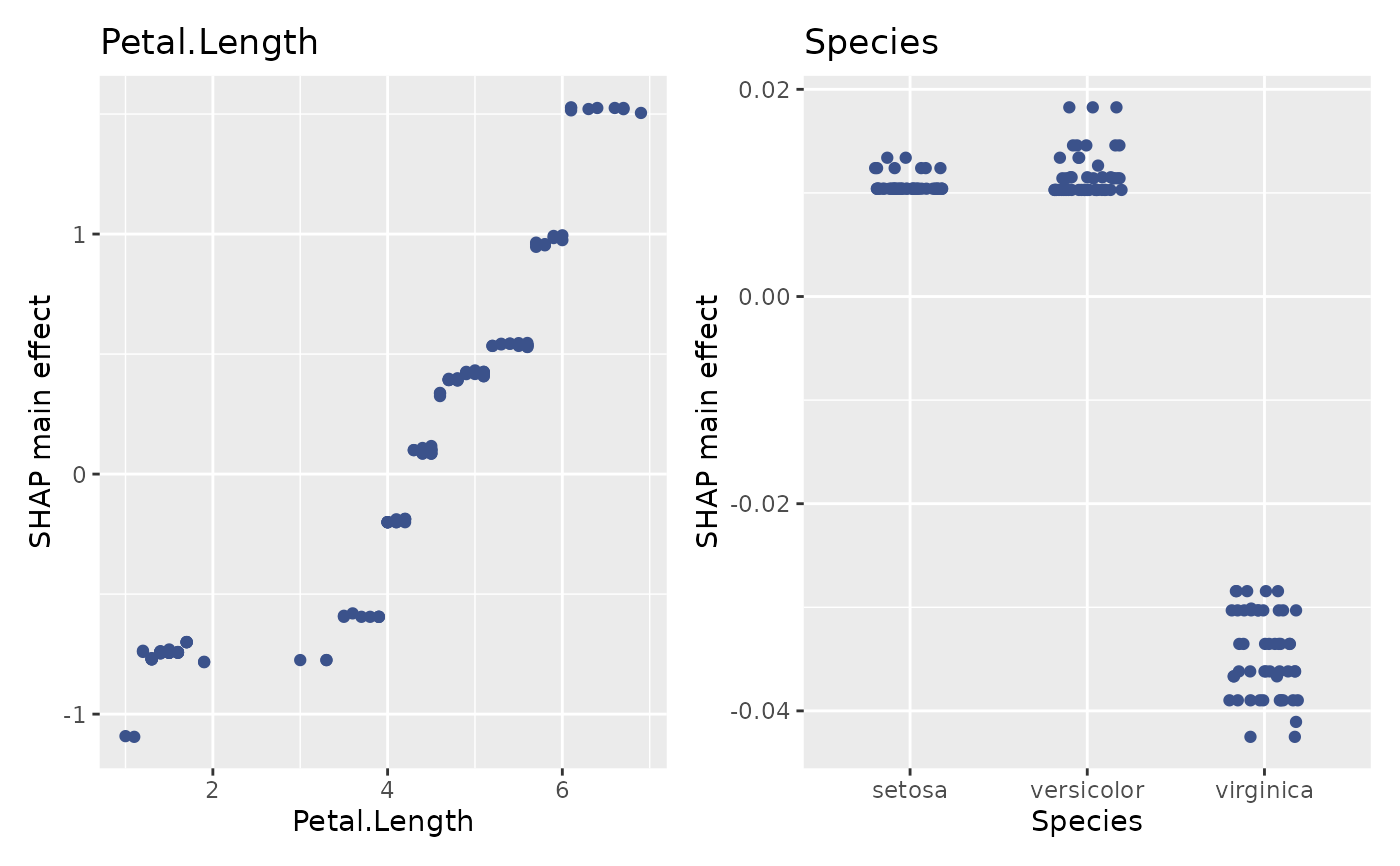
If SHAP interaction values are available, setting interactions = TRUE allows
to focus on pure interaction effects (multiplied by two) or on pure main effects.
By default, the feature on the color scale is selected via SHAP interactions
(if available) or an interaction heuristic, see potential_interactions().
sv_dependence(object, ...)

# Default S3 method
sv_dependence(object, ...)

# S3 method for class 'shapviz'
sv_dependence(
  object,
  v,
  color_var = "auto",
  color = "#3b528b",
  viridis_args = getOption("shapviz.viridis_args"),
  jitter_width = NULL,
  interactions = FALSE,
  ih_nbins = NULL,
  ih_color_num = TRUE,
  ih_scale = FALSE,
  ih_adjusted = FALSE,
  share_y = FALSE,
  ylim = NULL,
  seed = 1L,
  ...
)

# S3 method for class 'mshapviz'
sv_dependence(
  object,
  v,
  color_var = "auto",
  color = "#3b528b",
  viridis_args = getOption("shapviz.viridis_args"),
  jitter_width = NULL,
  interactions = FALSE,
  ih_nbins = NULL,
  ih_color_num = TRUE,
  ih_scale = FALSE,
  ih_adjusted = FALSE,
  share_y = FALSE,
  ylim = NULL,
  seed = 1L,
  ...
)
Arguments
- object
An object of class "(m)shapviz".
- ...
Arguments passed to
ggplot2::geom_jitter().- v
Column name of feature to be plotted. Can be a vector/list if
objectis of class "shapviz".- color_var
Feature name to be used on the color scale to investigate interactions. The default ("auto") uses SHAP interaction values (if available), or a heuristic to select the strongest interacting feature. Set to
NULLto not use the color axis. Can be a vector/list ifobjectis of class "shapviz".- color
Color to be used if
color_var = NULL. Can be a vector/list ifvis a vector.- viridis_args
List of viridis color scale arguments, see
?ggplot2::scale_color_viridis_c. The default points to the global optionshapviz.viridis_args, which corresponds tolist(begin = 0.25, end = 0.85, option = "inferno"). These values are passed toggplot2::scale_color_viridis_*(). For example, to switch to a standard viridis scale, you can either change the default viaoptions(shapviz.viridis_args = list()), or setviridis_args = list(). Only relevant ifcolor_varis notNULL.- jitter_width
The amount of horizontal jitter. The default (
NULL) will use a value of 0.2 in casevis discrete, and no jitter otherwise. (Numeric variables are considered discrete if they have at most 7 unique values.) Can be a vector/list ifvis a vector.- interactions
Should SHAP interaction values be plotted? Default is
FALSE. Requires SHAP interaction values. Ifcolor_var = NULL(or is equal tov), the pure main effect ofvis visualized. Otherwise, twice the SHAP interaction values betweenvand thecolor_varare plotted.- ih_nbins, ih_color_num, ih_scale, ih_adjusted
Interaction heuristic (ih) parameters used to select the color variable, see
potential_interactions(). Only used ifcolor_var = "auto"and if there are no SHAP interaction values.Should y axis be shared across subplots? The default is FALSE. Has no effect if
ylimis passed. Only for multiple plots.- ylim
A vector of length 2 with manual y axis limits applied to all plots.
- seed
Random seed for jittering. Default is 1L. Note that this does not modify the global seed.
Value
An object of class "ggplot" (or "patchwork") representing a dependence plot.
Methods (by class)
sv_dependence(default): Default method.sv_dependence(shapviz): SHAP dependence plot for "shapviz" object.sv_dependence(mshapviz): SHAP dependence plot for "mshapviz" object.
See also
Examples
dtrain <- xgboost::xgb.DMatrix(
data.matrix(iris[, -1]),
label = iris[, 1], nthread = 1
)
fit <- xgboost::xgb.train(data = dtrain, nrounds = 10, nthread = 1)
x <- shapviz(fit, X_pred = dtrain, X = iris)
sv_dependence(x, "Petal.Length")
 sv_dependence(x, "Petal.Length", color_var = "Species")
 sv_dependence(x, "Petal.Length", color_var = NULL)
 sv_dependence(x, c("Species", "Petal.Length"), share_y = TRUE)
 sv_dependence(x, "Petal.Width", color_var = c("Species", "Petal.Length")) +
patchwork::plot_layout(ncol = 1)
 # SHAP interaction values/main effects
x2 <- shapviz(fit, X_pred = dtrain, X = iris, interactions = TRUE)
sv_dependence(x2, "Petal.Length", interactions = TRUE)
 sv_dependence(
x2, c("Petal.Length", "Species"),
color_var = NULL, interactions = TRUE
)
 sv_dependence(
x2, "Petal.Length",
color_var = colnames(iris[-1]), interactions = TRUE,
share_y = TRUE
)
