Experimental variable importance method based on partial dependence functions.
While related to Greenwell et al., our suggestion measures not only main effect
strength but also interaction effects. It is very closely related to \(H^2_j\),
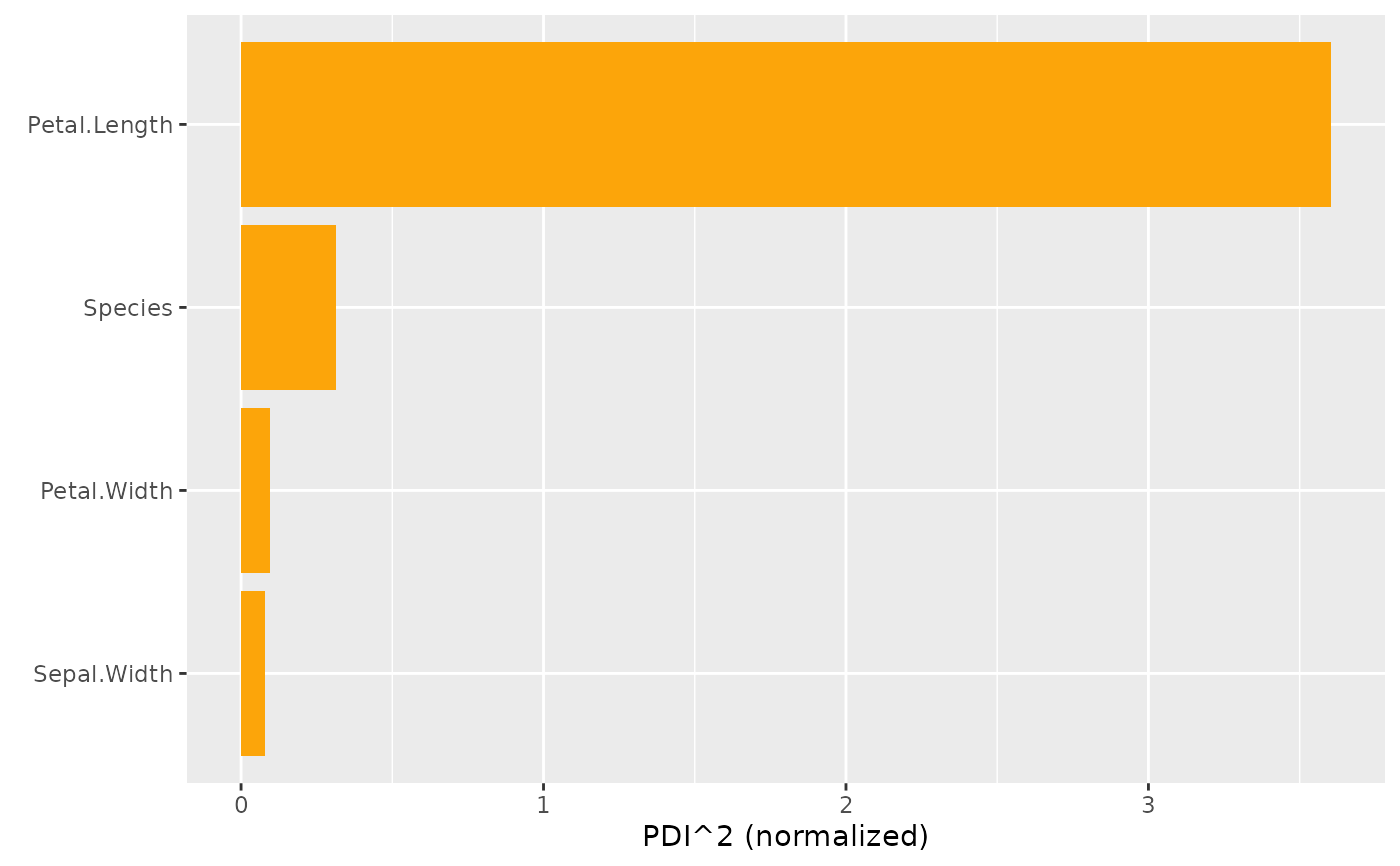
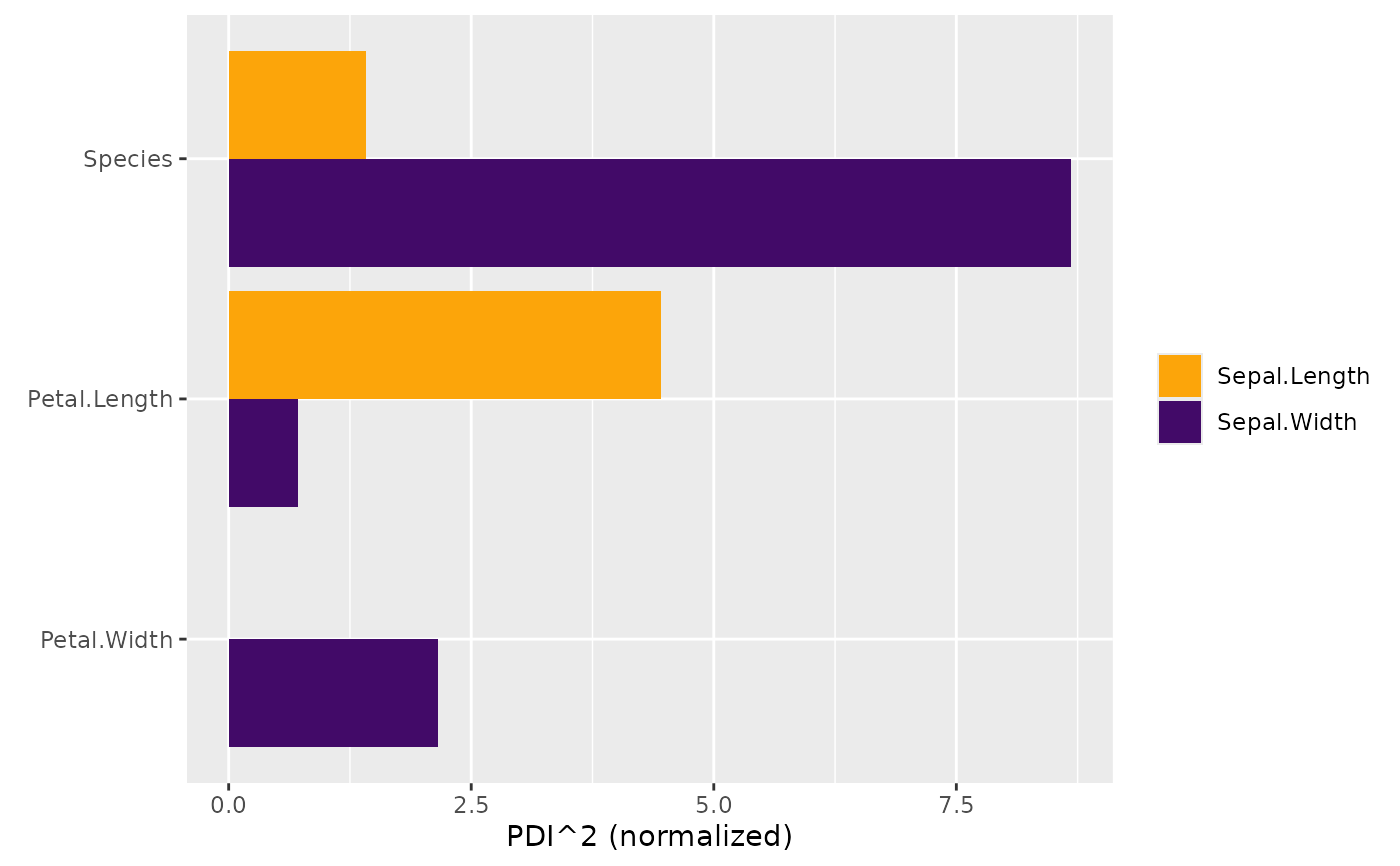
see Details. Use plot() to get a barplot.
pd_importance(object, ...)

# Default S3 method
pd_importance(object, ...)

# S3 method for class 'hstats'
pd_importance(
  object,
  normalize = TRUE,
  squared = TRUE,
  sort = TRUE,
  zero = TRUE,
  ...
)
Arguments
- object
Object of class "hstats".
- ...
Currently unused.
- normalize
Should statistics be normalized? Default is
TRUE.- squared
Should squared statistics be returned? Default is
TRUE.- sort
Should results be sorted? Default is
TRUE. (Multi-output is sorted by row means.)- zero
Should rows with all 0 be shown? Default is
TRUE.
Value
An object of class "hstats_matrix" containing these elements:
M: Matrix of statistics (one column per prediction dimension), orNULL.SE: Matrix with standard errors ofM, orNULL. Multiply withsqrt(m_rep)to get standard deviations instead. Currently, supported only forperm_importance().m_rep: The number of repetitions behind standard errorsSE, orNULL. Currently, supported only forperm_importance().statistic: Name of the function that generated the statistic.description: Description of the statistic.
Details
If \(x_j\) has no effects, the (centered) prediction function \(F\)
equals the (centered) partial dependence \(F_{\setminus j}\) on all other
features \(\mathbf{x}_{\setminus j}\), i.e.,
$$
F(\mathbf{x}) = F_{\setminus j}(\mathbf{x}_{\setminus j}).
$$
Therefore, the following measure of variable importance follows:
$$
\textrm{PDI}_j = \frac{\frac{1}{n} \sum_{i = 1}^n\big[F(\mathbf{x}_i) -
\hat F_{\setminus j}(\mathbf{x}_{i\setminus j})\big]^2}{\frac{1}{n} \sum_{i = 1}^n
\big[F(\mathbf{x}_i)\big]^2}.
$$
It differs from \(H^2_j\) only by not subtracting the main effect of the \(j\)-th
feature in the numerator. It can be read as the proportion of prediction variability
unexplained by all other features. As such, it measures variable importance of
the \(j\)-th feature, including its interaction effects (check partial_dep()
for all definitions).
Remarks 1 to 4 of h2_overall() also apply here.
Methods (by class)
pd_importance(default): Default method of PD based feature importance.pd_importance(hstats): PD based feature importance from "hstats" object.
References
Greenwell, Brandon M., Bradley C. Boehmke, and Andrew J. McCarthy. A Simple and Effective Model-Based Variable Importance Measure. Arxiv (2018).
See also
Examples
# MODEL 1: Linear regression
fit <- lm(Sepal.Length ~ . , data = iris)
s <- hstats(fit, X = iris[, -1])
#> 1-way calculations...
#>
  |
  |                                                                      |   0%
  |
  |==================                                                    |  25%
  |
  |===================================                                   |  50%
  |
  |====================================================                  |  75%
  |
  |======================================================================| 100%
plot(pd_importance(s))


# MODEL 2: Multi-response linear regression
fit <- lm(as.matrix(iris[, 1:2]) ~ Petal.Length + Petal.Width + Species, data = iris)
s <- hstats(fit, X = iris[, 3:5])
#> 1-way calculations...
#>
  |
  |                                                                      |   0%
  |
  |=======================                                               |  33%
  |
  |===============================================                       |  67%
  |
  |======================================================================| 100%
plot(pd_importance(s))
