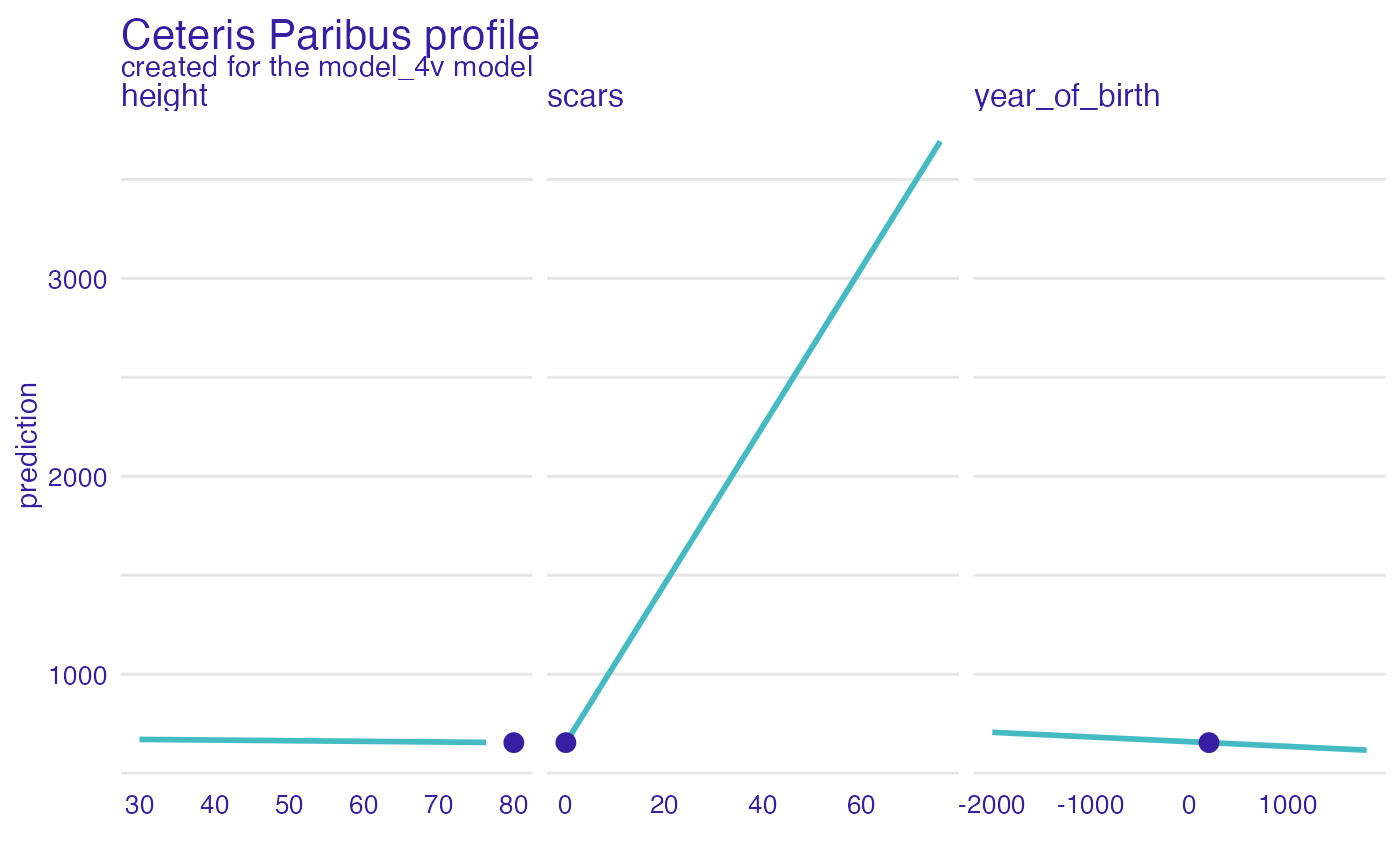
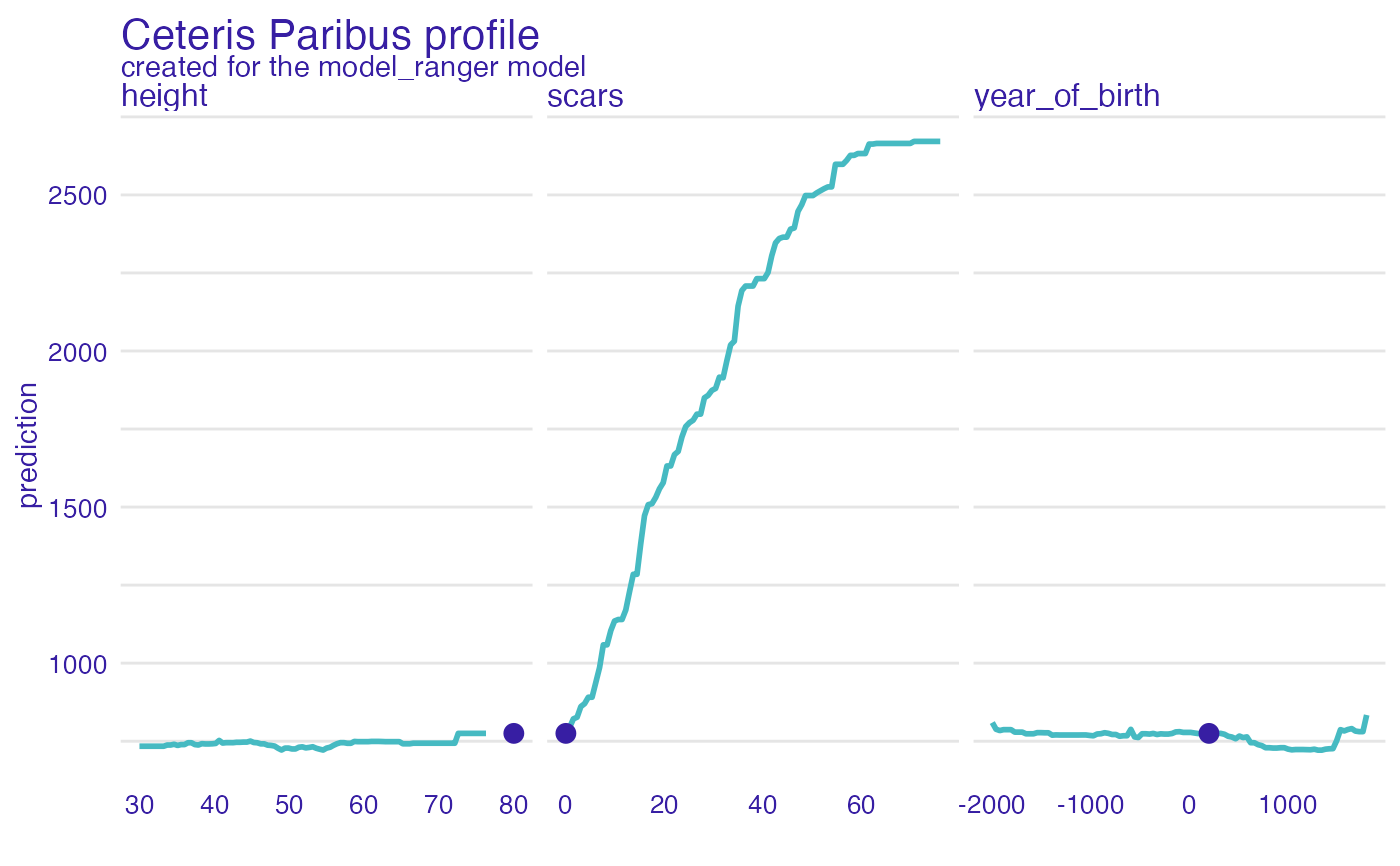
This function calculated individual profiles aka Ceteris Paribus Profiles.
From DALEX version 1.0 this function calls the ceteris_paribus from the ingredients package.
Find information how to use this function here: https://ema.drwhy.ai/ceterisParibus.html.
predict_profile(
  explainer,
  new_observation,
  variables = NULL,
  ...,
  type = "ceteris_paribus",
  variable_splits_type = "uniform"
)

individual_profile(
  explainer,
  new_observation,
  variables = NULL,
  ...,
  type = "ceteris_paribus",
  variable_splits_type = "uniform"
)
Arguments
- explainer
a model to be explained, preprocessed by the
explainfunction- new_observation
a new observation for which predictions need to be explained
- variables
character - names of variables to be explained
- ...
other parameters
- type
character, currently only the
ceteris_paribusis implemented- variable_splits_type
how variable grids shall be calculated? Use "quantiles" (default) for percentiles or "uniform" to get uniform grid of points. Will be passed to `ingredients`.
Value
An object of the class ceteris_paribus_explainer.
It's a data frame with calculated average response.
References
Explanatory Model Analysis. Explore, Explain, and Examine Predictive Models. https://ema.drwhy.ai/
Examples
new_dragon <- data.frame(year_of_birth = 200,
     height = 80,
     weight = 12.5,
     scars = 0,
     number_of_lost_teeth  = 5)

dragon_lm_model4 <- lm(life_length ~ year_of_birth + height +
                                     weight + scars + number_of_lost_teeth,
                       data = dragons)
dragon_lm_explainer4 <- explain(dragon_lm_model4, data = dragons, y = dragons$year_of_birth,
                                label = "model_4v")
#> Preparation of a new explainer is initiated
#>   -> model label       :  model_4v
#>   -> data              :  2000  rows  8  cols
#>   -> target variable   :  2000  values
#>   -> predict function  :  yhat.lm  will be used (  default  )
#>   -> predicted values  :  No value for predict function target column. (  default  )
#>   -> model_info        :  package stats , ver. 4.2.3 , task regression (  default  )
#>   -> predicted values  :  numerical, min =  541.1056 , mean =  1370.986 , max =  3928.189
#>   -> residual function :  difference between y and yhat (  default  )
#>   -> residuals         :  numerical, min =  -5421.316 , mean =  -1450.523 , max =  1176.912
#>   A new explainer has been created!
dragon_lm_predict4 <- predict_profile(dragon_lm_explainer4,
                new_observation = new_dragon,
                variables = c("year_of_birth", "height", "scars"))
head(dragon_lm_predict4)
#> Top profiles    :
#>     year_of_birth height weight scars number_of_lost_teeth   _yhat_
#> 1        -1999.00     80   12.5     0                    5 706.2869
#> 1.1      -1961.01     80   12.5     0                    5 705.3847
#> 1.2      -1923.02     80   12.5     0                    5 704.4825
#> 1.3      -1885.03     80   12.5     0                    5 703.5803
#> 1.4      -1847.04     80   12.5     0                    5 702.6780
#> 1.5      -1809.05     80   12.5     0                    5 701.7758
#>           _vname_ _ids_  _label_
#> 1   year_of_birth     1 model_4v
#> 1.1 year_of_birth     1 model_4v
#> 1.2 year_of_birth     1 model_4v
#> 1.3 year_of_birth     1 model_4v
#> 1.4 year_of_birth     1 model_4v
#> 1.5 year_of_birth     1 model_4v
#>
#>
#> Top observations:
#>   year_of_birth height weight scars number_of_lost_teeth   _yhat_  _label_
#> 1           200     80   12.5     0                    5 654.0636 model_4v
#>   _ids_
#> 1     1
plot(dragon_lm_predict4,
    variables = c("year_of_birth", "height", "scars"))


# \donttest{
library("ranger")
dragon_ranger_model4 <- ranger(life_length ~ year_of_birth + height +
                                               weight + scars + number_of_lost_teeth,
                                 data = dragons, num.trees = 50)
dragon_ranger_explainer4 <- explain(dragon_ranger_model4, data = dragons, y = dragons$year_of_birth,
                                label = "model_ranger")
#> Preparation of a new explainer is initiated
#>   -> model label       :  model_ranger
#>   -> data              :  2000  rows  8  cols
#>   -> target variable   :  2000  values
#>   -> predict function  :  yhat.ranger  will be used (  default  )
#>   -> predicted values  :  No value for predict function target column. (  default  )
#>   -> model_info        :  package ranger , ver. 0.14.1 , task regression (  default  )
#>   -> predicted values  :  numerical, min =  587.5616 , mean =  1370.765 , max =  3566.677
#>   -> residual function :  difference between y and yhat (  default  )
#>   -> residuals         :  numerical, min =  -4986.952 , mean =  -1450.302 , max =  1029.847
#>   A new explainer has been created!
dragon_ranger_predict4 <- predict_profile(dragon_ranger_explainer4,
                                           new_observation = new_dragon,
                                           variables = c("year_of_birth", "height", "scars"))
head(dragon_ranger_predict4)
#> Top profiles    :
#>     year_of_birth height weight scars number_of_lost_teeth   _yhat_
#> 1        -1999.00     80   12.5     0                    5 809.6815
#> 1.1      -1961.01     80   12.5     0                    5 788.3777
#> 1.2      -1923.02     80   12.5     0                    5 784.1321
#> 1.3      -1885.03     80   12.5     0                    5 786.9855
#> 1.4      -1847.04     80   12.5     0                    5 786.9855
#> 1.5      -1809.05     80   12.5     0                    5 786.9855
#>           _vname_ _ids_      _label_
#> 1   year_of_birth     1 model_ranger
#> 1.1 year_of_birth     1 model_ranger
#> 1.2 year_of_birth     1 model_ranger
#> 1.3 year_of_birth     1 model_ranger
#> 1.4 year_of_birth     1 model_ranger
#> 1.5 year_of_birth     1 model_ranger
#>
#>
#> Top observations:
#>   year_of_birth height weight scars number_of_lost_teeth   _yhat_      _label_
#> 1           200     80   12.5     0                    5 775.0935 model_ranger
#>   _ids_
#> 1     1
plot(dragon_ranger_predict4,
    variables = c("year_of_birth", "height", "scars"))

 # }
# }