XGBoost case
## Warning: package 'xgboost' was built under R version 3.5.2
## 'data.frame':    14999 obs. of  10 variables:
##  $ satisfaction_level   : num  0.38 0.8 0.11 0.72 0.37 0.41 0.1 0.92 0.89 0.42 ...
##  $ last_evaluation      : num  0.53 0.86 0.88 0.87 0.52 0.5 0.77 0.85 1 0.53 ...
##  $ number_project       : int  2 5 7 5 2 2 6 5 5 2 ...
##  $ average_montly_hours : int  157 262 272 223 159 153 247 259 224 142 ...
##  $ time_spend_company   : int  3 6 4 5 3 3 4 5 5 3 ...
##  $ Work_accident        : int  0 0 0 0 0 0 0 0 0 0 ...
##  $ left                 : int  1 1 1 1 1 1 1 1 1 1 ...
##  $ promotion_last_5years: int  0 0 0 0 0 0 0 0 0 0 ...
##  $ sales                : Factor w/ 10 levels "accounting","hr",..: 8 8 8 8 8 8 8 8 8 8 ...
##  $ salary               : Factor w/ 3 levels "high","low","medium": 2 3 3 2 2 2 2 2 2 2 ...
##
## Call:
## stats::glm(formula = left ~ xs(satisfaction_level) + xs(last_evaluation) +
##     number_project + xs(average_montly_hours) + time_spend_company +
##     Work_accident + promotion_last_5years + sales + salary, family = family,
##     data = data)
##
## Deviance Residuals:
##     Min       1Q   Median       3Q      Max
## -3.6566  -0.4484  -0.2223  -0.0284   3.2011
##
## Coefficients:
##                          Estimate Std. Error z value Pr(>|z|)
## (Intercept)               9.07884    0.34622  26.223  < 2e-16 ***
## xs(satisfaction_level)   -2.94843    0.07125 -41.383  < 2e-16 ***
## xs(last_evaluation)      -4.44209    0.16588 -26.779  < 2e-16 ***
## number_project           -0.39311    0.02533 -15.521  < 2e-16 ***
## xs(average_montly_hours) -2.16248    0.12928 -16.727  < 2e-16 ***
## time_spend_company        0.38107    0.01851  20.583  < 2e-16 ***
## Work_accident            -1.45516    0.10977 -13.257  < 2e-16 ***
## promotion_last_5years    -1.05742    0.28709  -3.683  0.00023 ***
## saleshr                   0.15624    0.16616   0.940  0.34708
## salesIT                  -0.27458    0.15585  -1.762  0.07809 .
## salesmanagement          -0.55376    0.20384  -2.717  0.00659 **
## salesmarketing           -0.12759    0.16521  -0.772  0.43994
## salesproduct_mng         -0.24057    0.16331  -1.473  0.14073
## salesRandD               -0.56603    0.18318  -3.090  0.00200 **
## salessales               -0.07321    0.12897  -0.568  0.57025
## salessupport              0.03285    0.13832   0.238  0.81226
## salestechnical            0.12093    0.13444   0.899  0.36839
## salarylow                 1.91403    0.15438  12.398  < 2e-16 ***
## salarymedium              1.34516    0.15522   8.666  < 2e-16 ***
## ---
## Signif. codes:  0 '***' 0.001 '**' 0.01 '*' 0.05 '.' 0.1 ' ' 1
##
## (Dispersion parameter for binomial family taken to be 1)
##
##     Null deviance: 16464.7  on 14998  degrees of freedom
## Residual deviance:  8410.7  on 14980  degrees of freedom
## AIC: 8448.7
##
## Number of Fisher Scoring iterations: 6
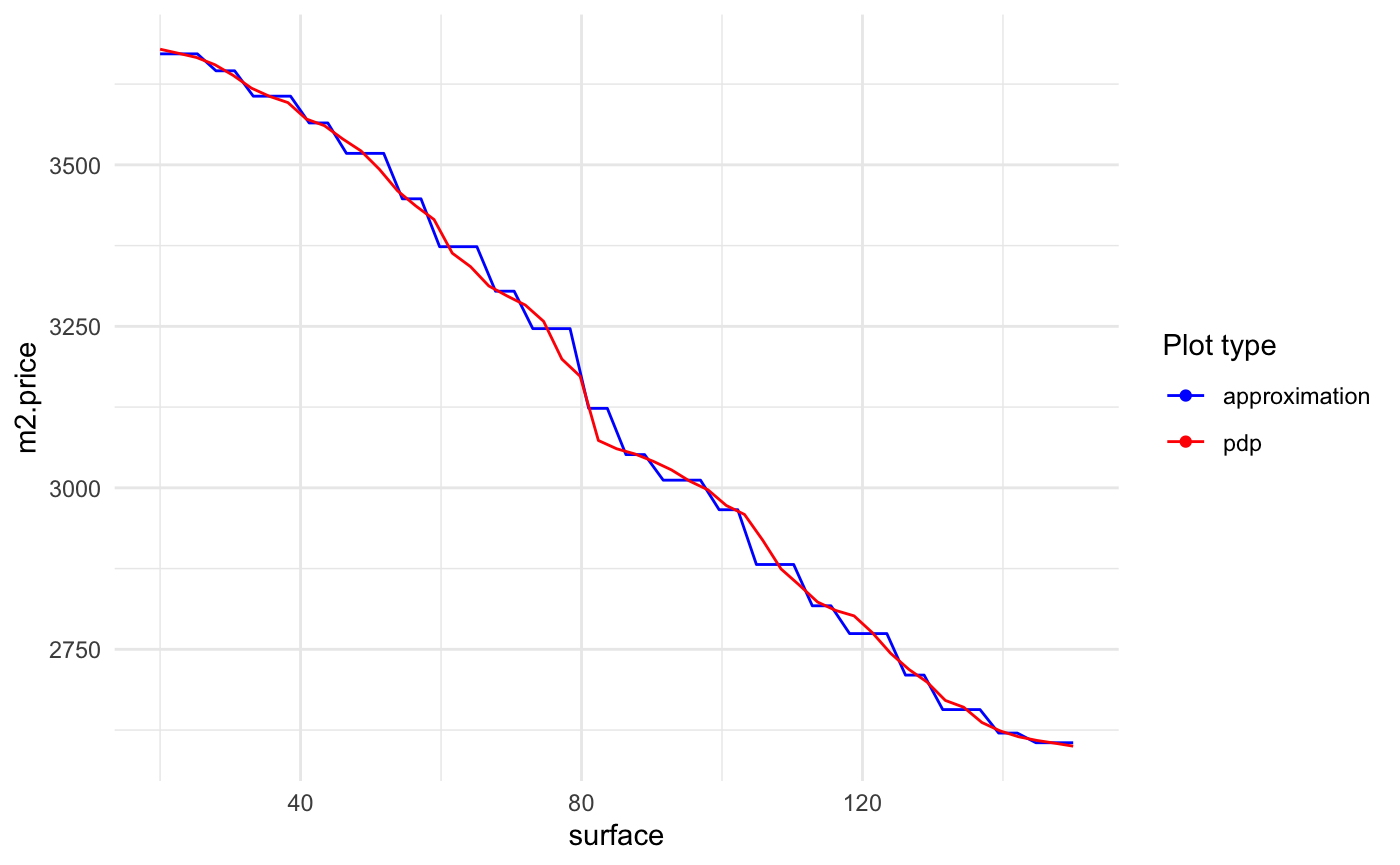
Partially constant approximation
## Warning: package 'caret' was built under R version 3.5.2
## Warning: package 'ggplot2' was built under R version 3.5.2
## Warning: Column `orig` joining factors with different levels, coercing to
## character vector