Builds predictive model based GLM.
xspline.RdThe method provides main functionality on building GLM models with automatic variables transformation.
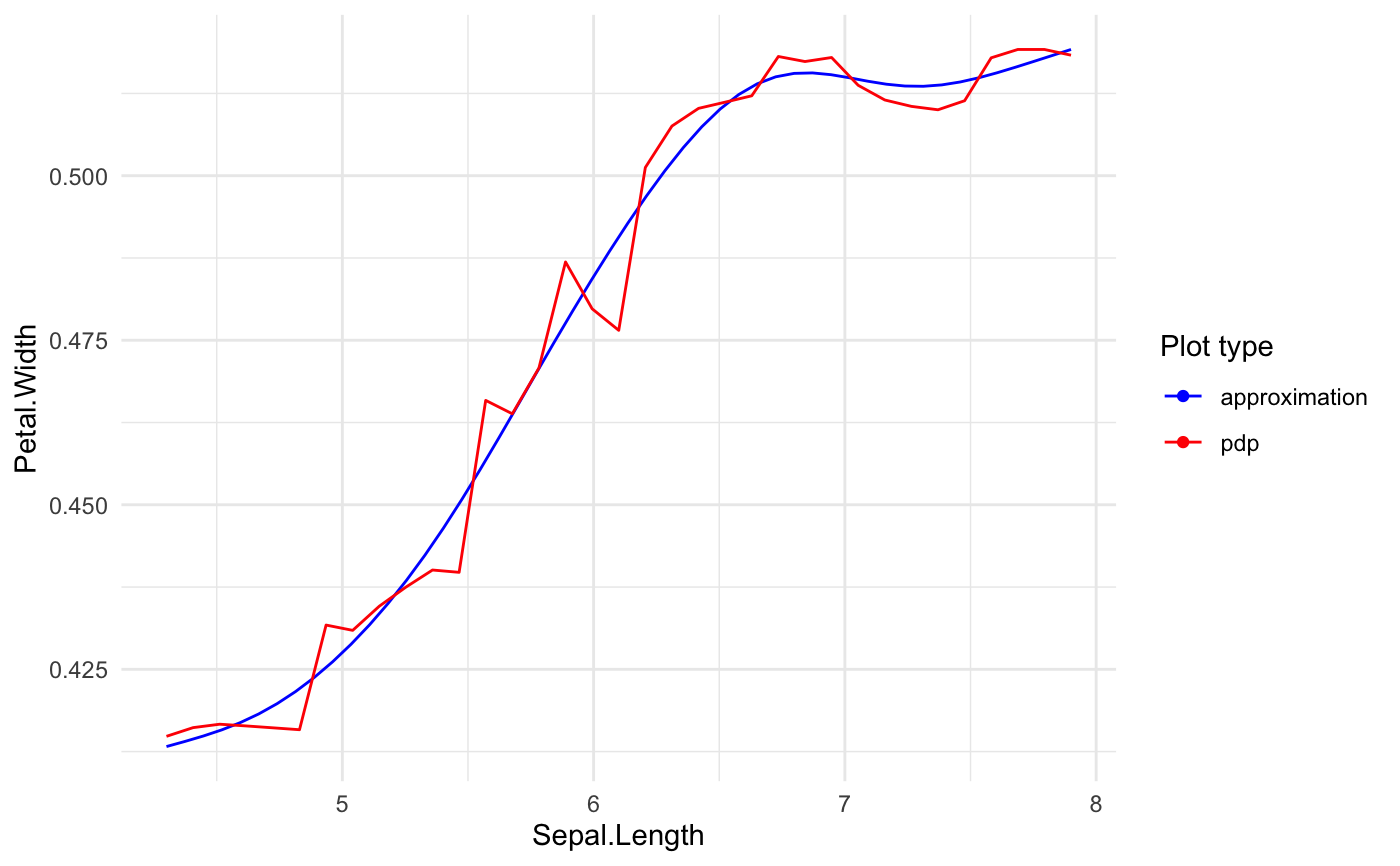
The transformations are based on specified single variable responses for selected black-box model.
See details in vignette("xspliner").
xspline(object, ...)

model_surrogate_xspliner(object, ...)

# S3 method for default
xspline(object, lhs = NULL, response = NULL,
  predictors = NULL, data = NULL, form = "additive", bare = NULL,
  env = parent.frame(), ...)

# S3 method for formula
xspline(object, model, data = NULL,
  consider = "specials", env = parent.frame(), ...)

# S3 method for explainer
xspline(object, env = parent.frame(), ...)
Arguments
| object | Predictive model, formula or explainer (see DALEX) object. |
|---|---|
| ... | Other arguments passed to |
| lhs | Left-hand side of model formula. Can be transformed response. |
| response | Name of response variable of |
| predictors | Predictor values that should be used in final model. |
| data | Training data of |
| form | Can be 'additive' (default) or 'multiplicative'. Specifies formula form in final model. |
| bare | Variable names that mustn't be transformed in final model. |
| env | Environment in which optional variables passed into parameters are stored. variables transformation. See vignette("xspliner") for details. |
| model | When |
| consider | One of |
Value
GLM object of class 'xspliner'.
Details
model_surrogate_xspliner is a wrapper of xspline method to assure consistency with https://github.com/ModelOriented/DrWhy tools
Examples
# preparing blackbox model library(randomForest) rf_iris <- randomForest( Petal.Width ~ Sepal.Length + Petal.Length + Species, data = iris) # formula based xspliner xs_iris <- xspline( Petal.Width ~ xs(Sepal.Length) + xs(Petal.Length) + xf(Species), model = rf_iris) summary(xs_iris)#> #> Call: #> stats::glm(formula = Petal.Width ~ xs(Sepal.Length) + xs(Petal.Length) + #> xf(Species), family = family, data = data) #> #> Deviance Residuals: #> Min 1Q Median 3Q Max #> -0.67489 -0.07877 -0.03048 0.09804 0.46780 #> #> Coefficients: #> Estimate Std. Error t value Pr(>|t|) #> (Intercept) -1.40810 0.30407 -4.631 8.03e-06 *** #> xs(Sepal.Length) 0.39342 0.36819 1.069 0.2871 #> xs(Petal.Length) 1.67365 0.35387 4.730 5.28e-06 *** #> xf(Species)versicolor 0.08582 0.17800 0.482 0.6304 #> xf(Species)virginica 0.41758 0.23705 1.762 0.0802 . #> --- #> Signif. codes: 0 ‘***’ 0.001 ‘**’ 0.01 ‘*’ 0.05 ‘.’ 0.1 ‘ ’ 1 #> #> (Dispersion parameter for gaussian family taken to be 0.03102474) #> #> Null deviance: 86.5699 on 149 degrees of freedom #> Residual deviance: 4.4986 on 145 degrees of freedom #> AIC: -88.349 #> #> Number of Fisher Scoring iterations: 2 #>#> #> Call: #> stats::glm(formula = Petal.Width ~ xs(Sepal.Length) + xs(Petal.Length) + #> xf(Species), family = family, data = data) #> #> Deviance Residuals: #> Min 1Q Median 3Q Max #> -0.67489 -0.07877 -0.03048 0.09804 0.46780 #> #> Coefficients: #> Estimate Std. Error t value Pr(>|t|) #> (Intercept) -1.40810 0.30407 -4.631 8.03e-06 *** #> xs(Sepal.Length) 0.39342 0.36819 1.069 0.2871 #> xs(Petal.Length) 1.67365 0.35387 4.730 5.28e-06 *** #> xf(Species)versicolor 0.08582 0.17800 0.482 0.6304 #> xf(Species)virginica 0.41758 0.23705 1.762 0.0802 . #> --- #> Signif. codes: 0 ‘***’ 0.001 ‘**’ 0.01 ‘*’ 0.05 ‘.’ 0.1 ‘ ’ 1 #> #> (Dispersion parameter for gaussian family taken to be 0.03102474) #> #> Null deviance: 86.5699 on 149 degrees of freedom #> Residual deviance: 4.4986 on 145 degrees of freedom #> AIC: -88.349 #> #> Number of Fisher Scoring iterations: 2 #>#> #>#> Preparation of a new explainer is initiated #> -> model label : randomForest ( default ) #> -> data : 150 rows 4 cols (extracted from the model) #> -> target variable : not specified! ( WARNING ) #> -> predict function : yhat.randomForest will be used ( default ) #> -> predicted values : numerical, min = 0.1977761 , mean = 1.199116 , max = 2.143874 #> -> residual function : difference between y and yhat ( default ) #> A new explainer has been created!#> #> Call: #> stats::glm(formula = Petal.Width ~ xs(Sepal.Length) + xs(Petal.Length) + #> xf(Species), family = family, data = data) #> #> Deviance Residuals: #> Min 1Q Median 3Q Max #> -0.67489 -0.07877 -0.03048 0.09804 0.46780 #> #> Coefficients: #> Estimate Std. Error t value Pr(>|t|) #> (Intercept) -1.40810 0.30407 -4.631 8.03e-06 *** #> xs(Sepal.Length) 0.39342 0.36819 1.069 0.2871 #> xs(Petal.Length) 1.67365 0.35387 4.730 5.28e-06 *** #> xf(Species)versicolor 0.08582 0.17800 0.482 0.6304 #> xf(Species)virginica 0.41758 0.23705 1.762 0.0802 . #> --- #> Signif. codes: 0 ‘***’ 0.001 ‘**’ 0.01 ‘*’ 0.05 ‘.’ 0.1 ‘ ’ 1 #> #> (Dispersion parameter for gaussian family taken to be 0.03102474) #> #> Null deviance: 86.5699 on 149 degrees of freedom #> Residual deviance: 4.4986 on 145 degrees of freedom #> AIC: -88.349 #> #> Number of Fisher Scoring iterations: 2 #>