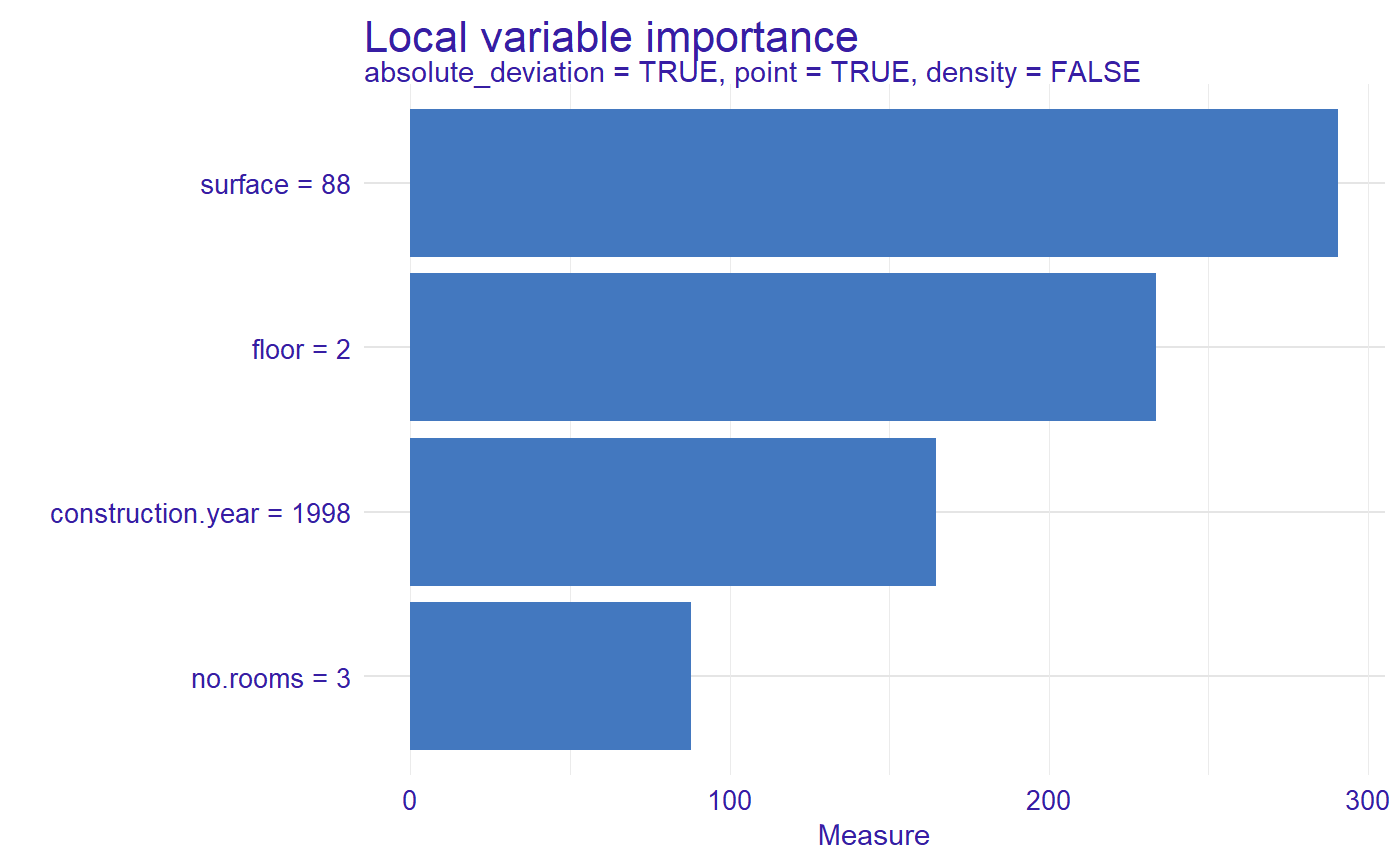
Function plot.local_importance plots local importance measure based on Ceteris Paribus profiles.
# S3 method for local_importance
plot(
  x,
  ...,
  variables = NULL,
  color = NULL,
  type = NULL,
  title = "Local variable importance"
)
Arguments
| x | object returned from |
|---|---|
| ... | other object returned from |
| variables | if not |
| color | a character. How to aggregated measure? Either "_label_method_" or "_label_model_". |
| type | a character. How variables shall be plotted? Either "bars" (default) or "lines". |
| title | the plot's title, by default |
Value
a ggplot2 object
Examples
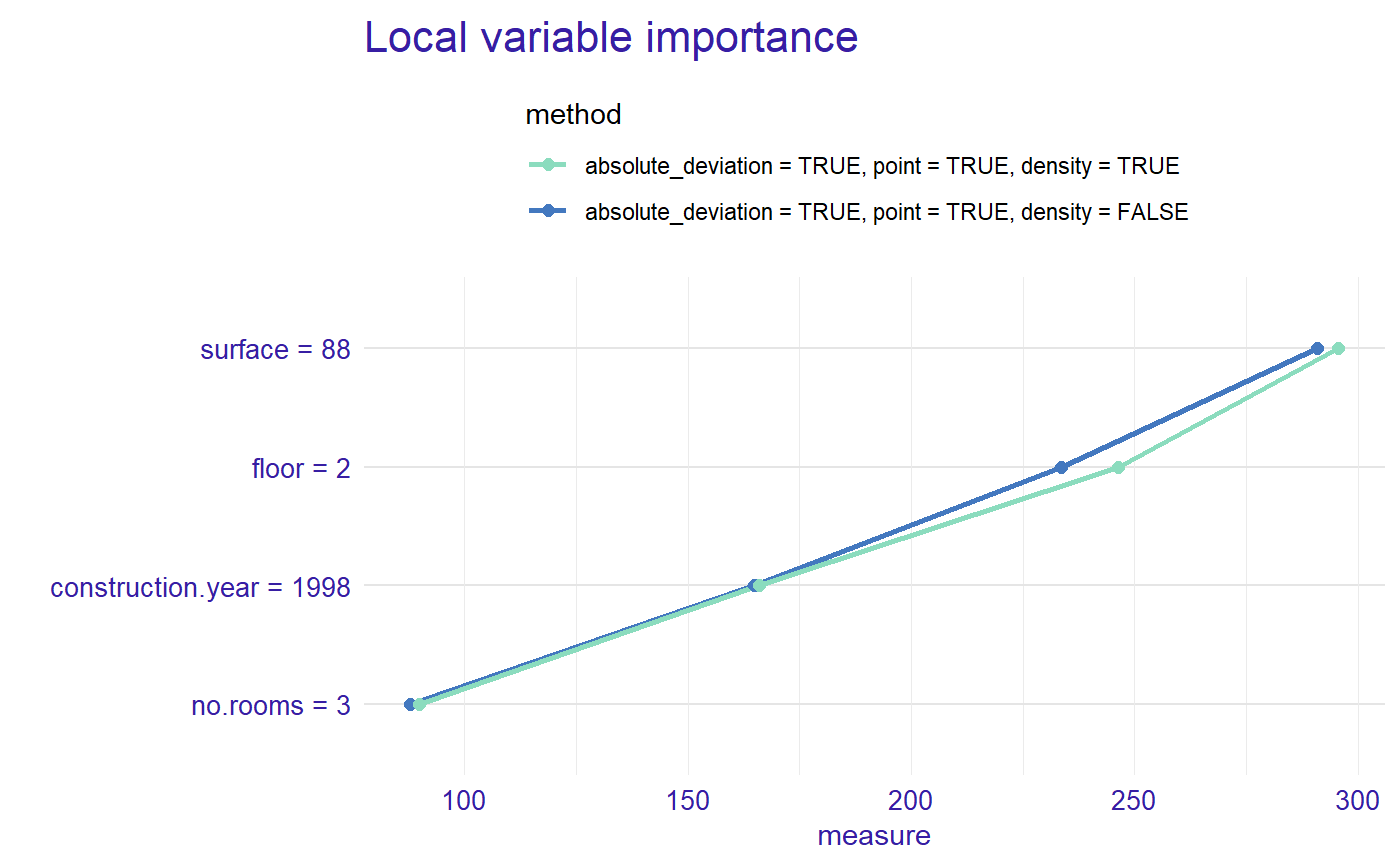
library("DALEX") data(apartments) library("randomForest") apartments_rf_model <- randomForest(m2.price ~ construction.year + surface + floor + no.rooms, data = apartments) explainer_rf <- explain(apartments_rf_model, data = apartmentsTest[,2:5], y = apartmentsTest$m2.price)#> Preparation of a new explainer is initiated #> -> model label : randomForest ( default ) #> -> data : 9000 rows 4 cols #> -> target variable : 9000 values #> -> predict function : yhat.randomForest will be used ( default ) #> -> predicted values : numerical, min = 2113.505 , mean = 3514.194 , max = 5405.559 #> -> model_info : package randomForest , ver. 4.6.14 , task regression ( default ) #> -> residual function : difference between y and yhat ( default ) #> -> residuals : numerical, min = -1224.547 , mean = -2.670117 , max = 2116.356 #> A new explainer has been created!new_apartment <- data.frame(construction.year = 1998, surface = 88, floor = 2L, no.rooms = 3) profiles <- predict_profile(explainer_rf, new_apartment) library("vivo") measure1 <- local_variable_importance(profiles, apartments[,2:5], absolute_deviation = TRUE, point = TRUE, density = FALSE) plot(measure1)measure2 <- local_variable_importance(profiles, apartments[,2:5], absolute_deviation = TRUE, point = TRUE, density = TRUE) plot(measure1, measure2, color = "_label_method_", type = "lines")