Example of global variable importance
Anna Kozak
2020-09-26
Source:vignettes/vignette_apartments_global.Rmd
vignette_apartments_global.RmdExample of global variable importance
In this vignette, we present a global variable importance measure based on Partial Dependence Profiles (PDP) for the random forest regression model.
1 Dataset
We work on Apartments dataset from DALEX package.
#>   m2.price construction.year surface floor no.rooms    district
#> 1     5897              1953      25     3        1 Srodmiescie
#> 2     1818              1992     143     9        5     Bielany
#> 3     3643              1937      56     1        2       Praga
#> 4     3517              1995      93     7        3      Ochota
#> 5     3013              1992     144     6        5     Mokotow
#> 6     5795              1926      61     6        2 Srodmiescie
2 Random forest regression model
Now, we define a random forest regression model and use explain() function from DALEX.
library("randomForest")
apartments_rf_model <- randomForest(m2.price ~ construction.year + surface + floor +
                                      no.rooms, data = apartments)
explainer_rf <- explain(apartments_rf_model,
                        data = apartmentsTest[,2:5], y = apartmentsTest$m2.price)
#> Preparation of a new explainer is initiated
#>   -> model label       :  randomForest  ( [33m default [39m )
#>   -> data              :  9000  rows  4  cols
#>   -> target variable   :  9000  values
#>   -> predict function  :  yhat.randomForest  will be used ( [33m default [39m )
#>   -> predicted values  :  numerical, min =  2100.162 , mean =  3515.328 , max =  5297.369
#>   -> model_info        :  package randomForest , ver. 4.6.14 , task regression ( [33m default [39m )
#>   -> residual function :  difference between y and yhat ( [33m default [39m )
#>   -> residuals         :  numerical, min =  -1213.577 , mean =  -3.804775 , max =  2170.683
#>  [32m A new explainer has been created! [39m
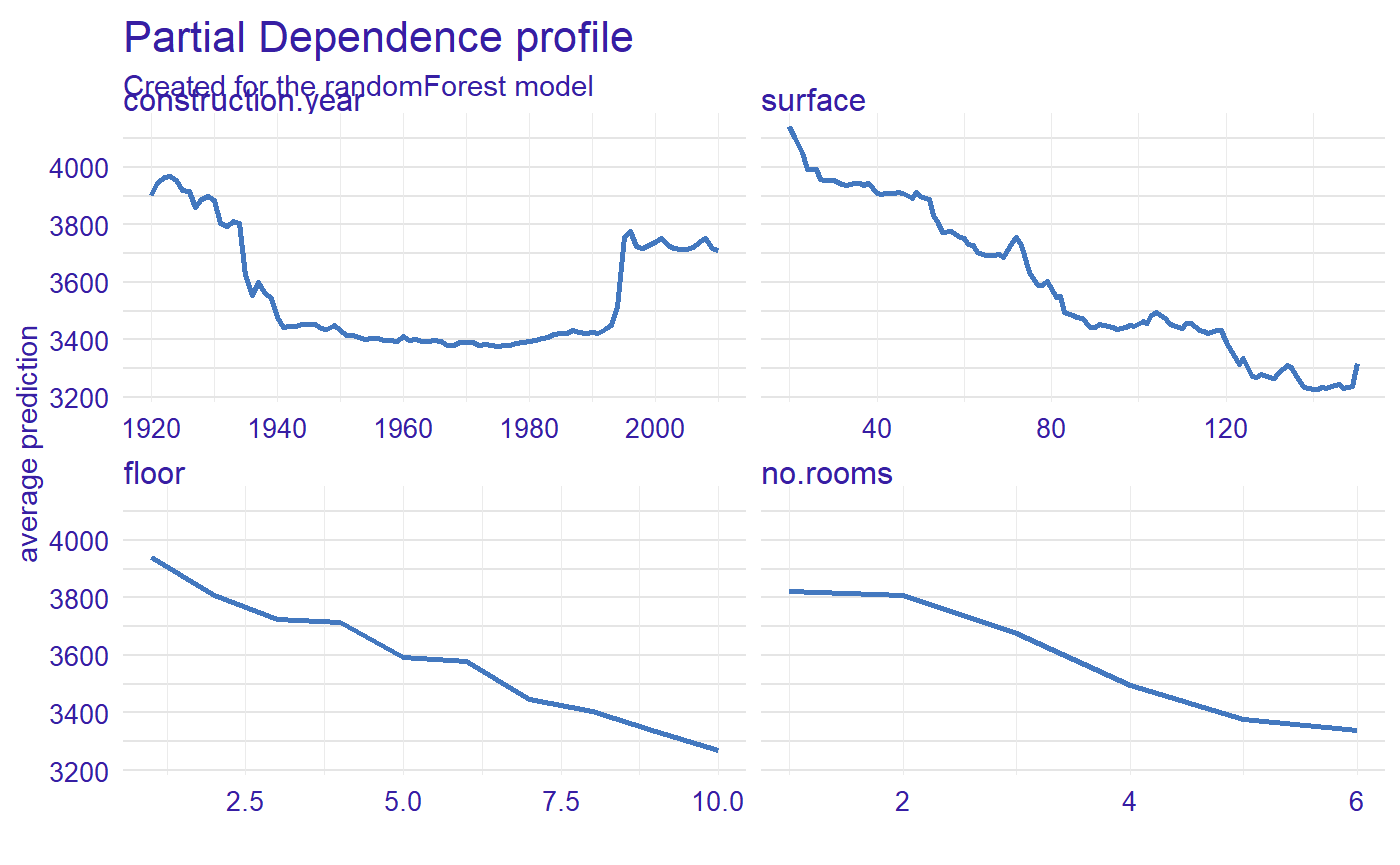
3 Calculate Partial Dependence Profiles
Let see the Partial Dependence Profiles calculated with DALEX::model_profile() function. The PDP also can be calculated with DALEX::variable_profile() or ingredients::partial_dependence().
profiles <- model_profile(explainer_rf)
plot(profiles)
4 Calculate measure of global variable importance
Now, we calculated a measure of global variable importance via oscillation based on PDP.
library("vivo")
measure <- global_variable_importance(profiles)
plot(measure)
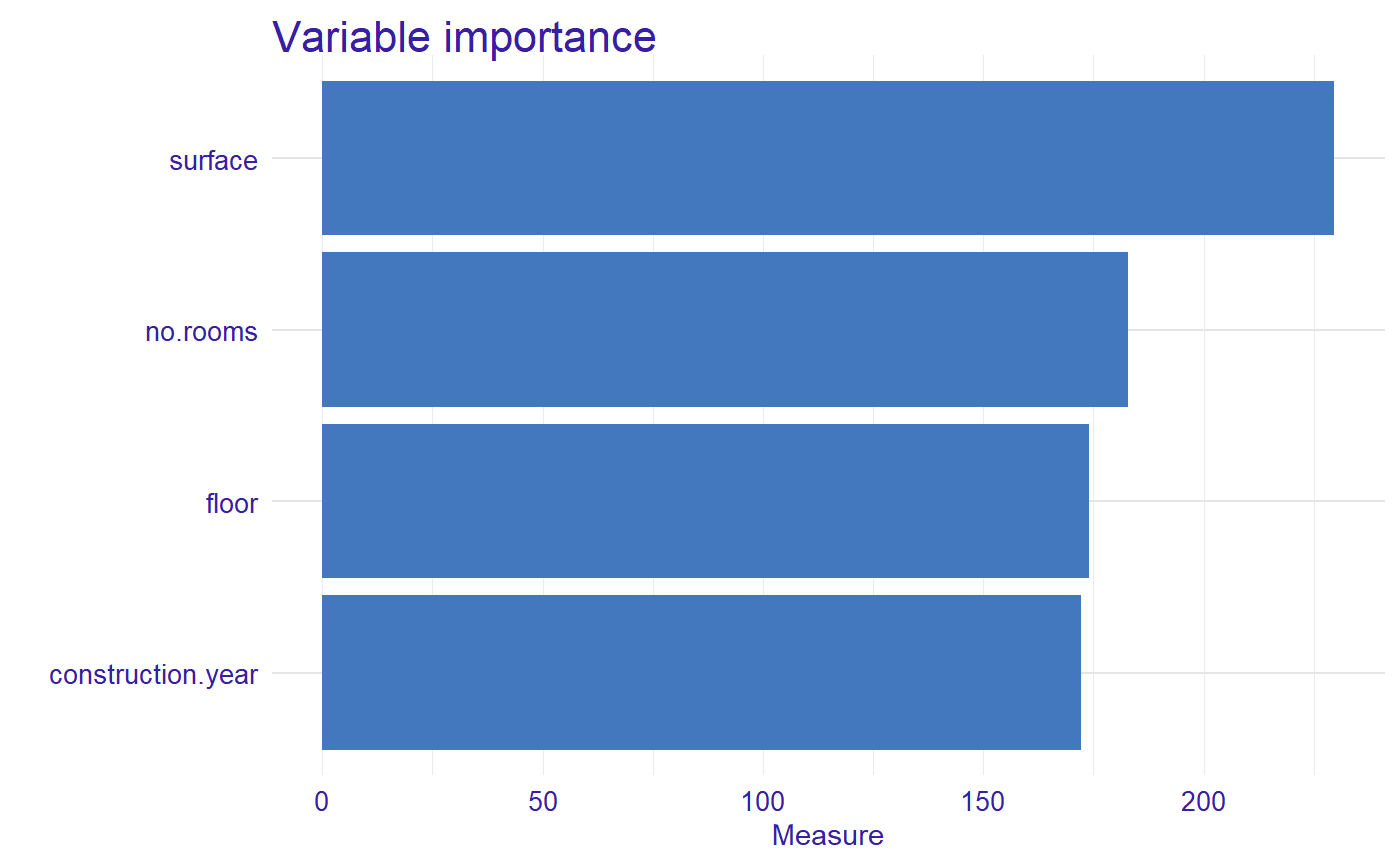
The most important variable is surface, then no.rooms, floor, and construction.year.
5 Comparison of the importance of variables for two or more models
Let created a linear regression model and explain object.
apartments_lm_model <- lm(m2.price ~ construction.year + surface + floor +
                                      no.rooms, data = apartments)
explainer_lm <- explain(apartments_lm_model,
                        data = apartmentsTest[,2:5], y = apartmentsTest$m2.price)
#> Preparation of a new explainer is initiated
#>   -> model label       :  lm  ( [33m default [39m )
#>   -> data              :  9000  rows  4  cols
#>   -> target variable   :  9000  values
#>   -> predict function  :  yhat.lm  will be used ( [33m default [39m )
#>   -> predicted values  :  numerical, min =  2231.8 , mean =  3507.346 , max =  4769.053
#>   -> model_info        :  package stats , ver. 3.6.3 , task regression ( [33m default [39m )
#>   -> residual function :  difference between y and yhat ( [33m default [39m )
#>   -> residuals         :  numerical, min =  -733.2516 , mean =  4.177813 , max =  2107.979
#>  [32m A new explainer has been created! [39m
We calculated Partial Dependence Profiles and measure.
profiles_lm <- model_profile(explainer_lm)

measure_lm <- global_variable_importance(profiles_lm)
plot(measure_lm, measure, type = "lines")
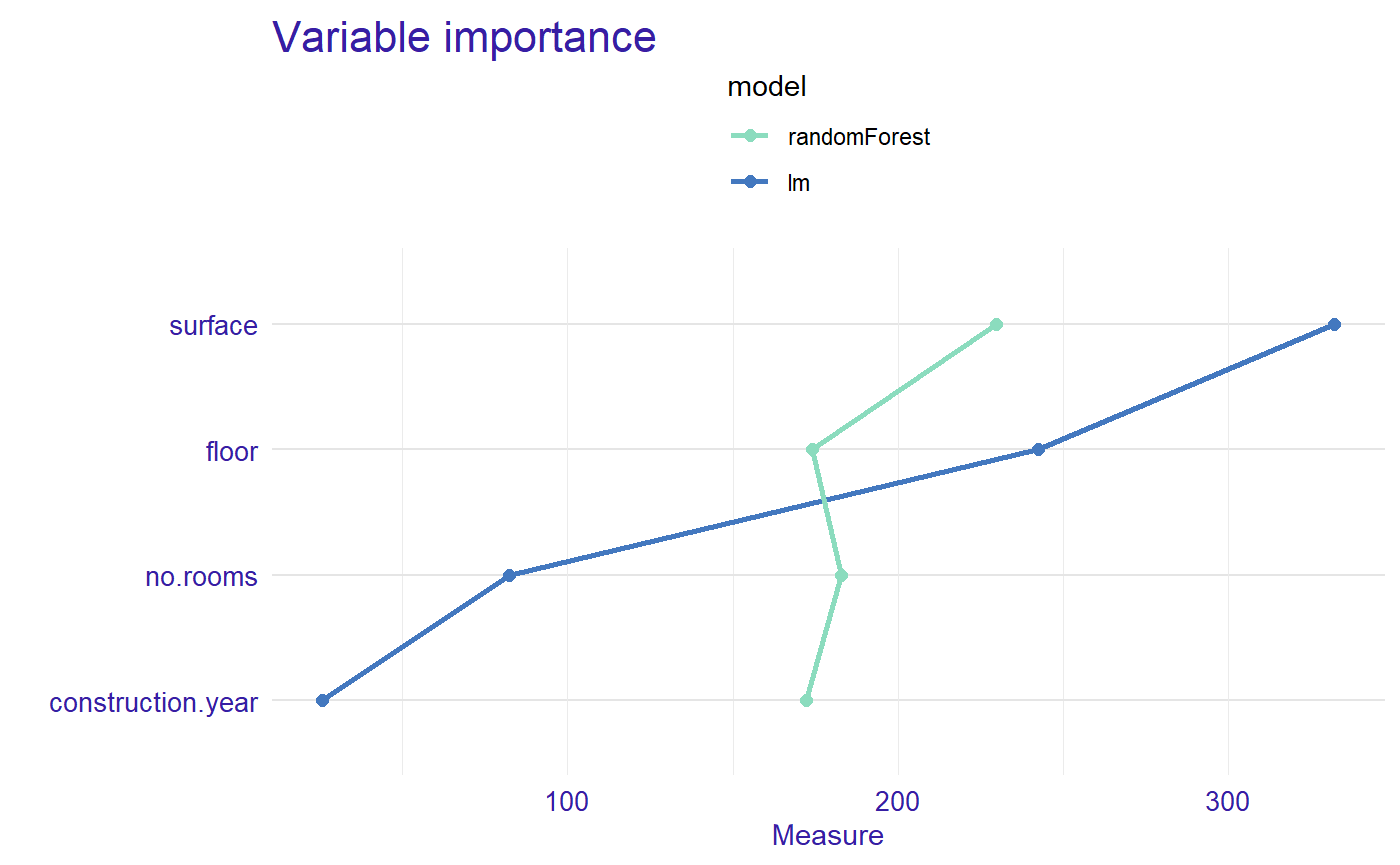
Now we can see the order of importance of variables by model.