Plot Model Performance Metrics for Survival Models
Source:R/plot_surv_model_performance.R
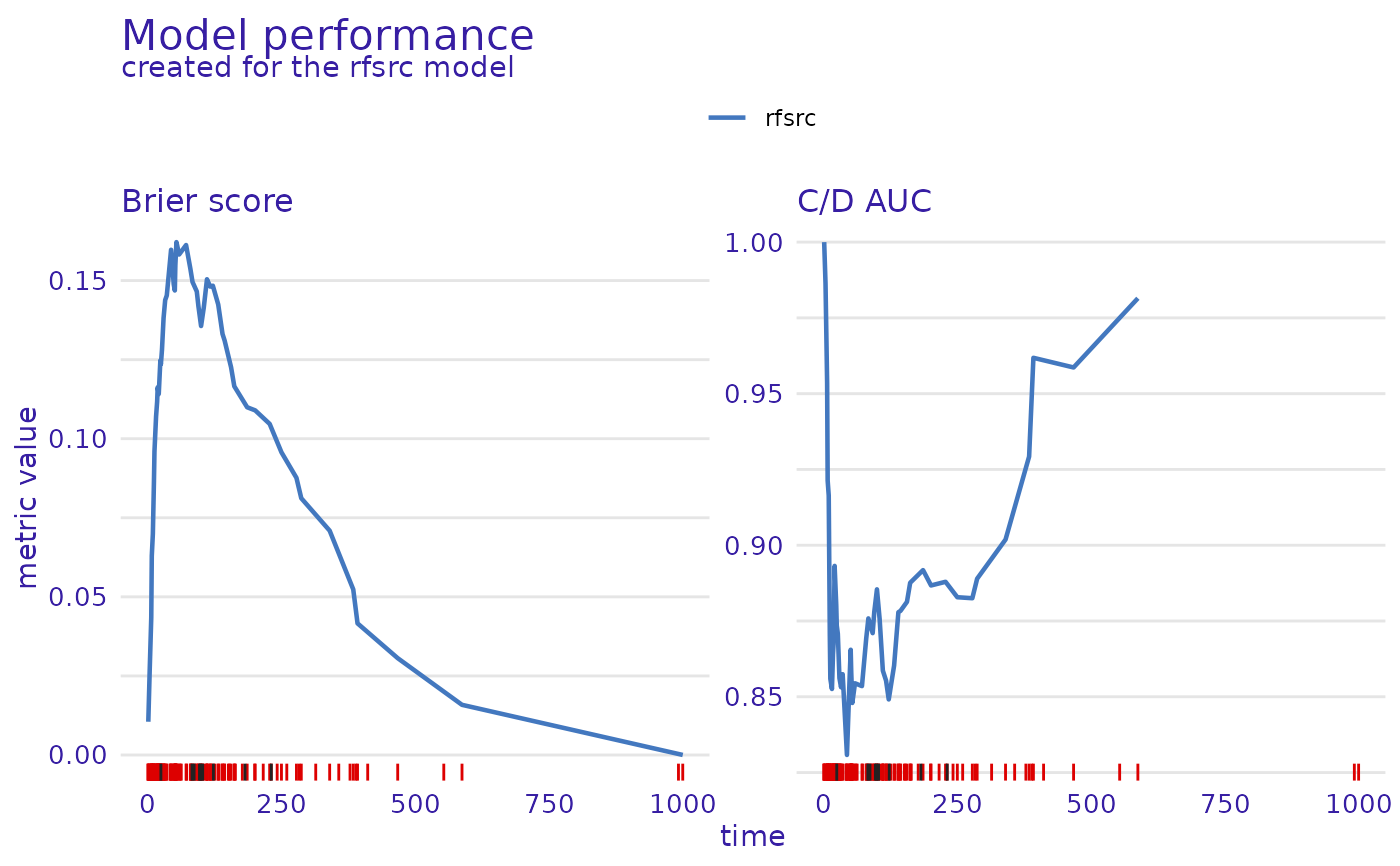
plot.surv_model_performance.RdThis function plots objects of class "surv_model_performance" - visualization of
metrics of different models created using the model_performance(..., type="metrics") function.
Arguments
- x
an object of class
"surv_model_performance"to be plotted- ...
additional objects of class
"surv_model_performance"to be plotted together- metrics
character, names of metrics to be plotted (subset of C/D AUC", "Brier score" for
metrics_type %in% c("time_dependent", "functional")or subset of "C-index","Integrated Brier score", "Integrated C/D AUC" formetrics_type == "scalar"), by default (NULL) all metrics of a given type are plotted- metrics_type
character, either one of
c("time_dependent","functional")for functional metrics or"scalar"for scalar metrics- title
character, title of the plot
- subtitle
character, subtitle of the plot,
'default'automatically generates "created for XXX, YYY models", where XXX and YYY are the explainer labels- facet_ncol
number of columns for arranging subplots
- colors
character vector containing the colors to be used for plotting variables (containing either hex codes "#FF69B4", or names "blue")
- rug
character, one of
"all","events","censors","none"orNULL. Which times to mark on the x axis ingeom_rug().- rug_colors
character vector containing two colors (containing either hex codes "#FF69B4", or names "blue"). The first color (red by default) will be used to mark event times, whereas the second (grey by default) will be used to mark censor times.
Value
An object of the class ggplot.
See also
Other functions for plotting 'model_performance_survival' objects:
plot.model_performance_survival(),
plot.surv_model_performance_rocs()
Examples
library(survival)
library(survex)

# \donttest{
model <- randomForestSRC::rfsrc(Surv(time, status) ~ ., data = veteran)
exp <- explain(model)
#> Preparation of a new explainer is initiated
#>   -> model label       :  rfsrc (  default  )
#>   -> data              :  137  rows  6  cols (  extracted from the model  )
#>   -> target variable   :  137  values ( 128 events and 9 censored , censoring rate = 0.066 ) (  extracted from the model  )
#>   -> times             :  50 unique time points , min = 1.5 , median survival time = 80 , max = 999
#>   -> times             :  (  generated from y as uniformly distributed survival quantiles based on Kaplan-Meier estimator  )
#>   -> predict function  :  sum over the predict_cumulative_hazard_function will be used (  default  )
#>   -> predict survival function  :  stepfun based on predict.rfsrc()$survival will be used (  default  )
#>   -> predict cumulative hazard function  :  stepfun based on predict.rfsrc()$chf will be used (  default  )
#>   -> model_info        :  package randomForestSRC , ver. 3.2.3 , task survival (  default  )
#>   A new explainer has been created!

m_perf <- model_performance(exp)
plot(m_perf)
#> Warning: Removed 1 row containing missing values or values outside the scale range
#> (`geom_line()`).

# }
# }