Plot Model Performance for Survival Models
Source:R/plot_model_performance_survival.R
plot.model_performance_survival.RdThis function is a wrapper for plotting model_performance objects created for survival models
using the model_performance() function.
# S3 method for model_performance_survival
plot(x, ...)
Arguments
- x
an object of class
"model_performance_survival"to be plotted- ...
additional parameters passed to the
plot.surv_model_performanceorplot.surv_model_performance_rocsfunction
Value
An object of the class ggplot.
Plot options
plot.surv_model_performance
x- an object of class"surv_model_performance"to be plotted...- additional objects of class"surv_model_performance"to be plotted togethermetrics- character, names of metrics to be plotted (subset of C/D AUC", "Brier score" formetrics_type %in% c("time_dependent", "functional")or subset of "C-index","Integrated Brier score", "Integrated C/D AUC" formetrics_type == "scalar"), by default (NULL) all metrics of a given type are plottedmetrics_type- character, either one ofc("time_dependent","functional")for functional metrics or"scalar"for scalar metricstitle- character, title of the plotsubtitle- character, subtitle of the plot,'default'automatically generates "created for XXX, YYY models", where XXX and YYY are the explainer labelsfacet_ncol- number of columns for arranging subplotscolors- character vector containing the colors to be used for plotting variables (containing either hex codes "#FF69B4", or names "blue")rug- character, one of"all","events","censors","none"orNULL. Which times to mark on the x axis ingeom_rug().rug_colors- character vector containing two colors (containing either hex codes "#FF69B4", or names "blue"). The first color (red by default) will be used to mark event times, whereas the second (grey by default) will be used to mark censor times.
plot.surv_model_performance_rocs
x- an object of class"surv_model_performance_rocs"to be plotted...- additional objects of class"surv_model_performance_rocs"to be plotted togethertitle- character, title of the plotsubtitle- character, subtitle of the plot,'default'automatically generates "created for XXX, YYY models", where XXX and YYY are the explainer labelscolors- character vector containing the colors to be used for plotting variables (containing either hex codes "#FF69B4", or names "blue")facet_ncol- number of columns for arranging subplots
See also
Other functions for plotting 'model_performance_survival' objects:
plot.surv_model_performance_rocs(),
plot.surv_model_performance()
Examples
# \donttest{
library(survival)
library(survex)
model <- randomForestSRC::rfsrc(Surv(time, status) ~ ., data = veteran)
exp <- explain(model)
#> Preparation of a new explainer is initiated
#> -> model label : rfsrc ( default )
#> -> data : 137 rows 6 cols ( extracted from the model )
#> -> target variable : 137 values ( 128 events and 9 censored , censoring rate = 0.066 ) ( extracted from the model )
#> -> times : 50 unique time points , min = 1.5 , median survival time = 80 , max = 999
#> -> times : ( generated from y as uniformly distributed survival quantiles based on Kaplan-Meier estimator )
#> -> predict function : sum over the predict_cumulative_hazard_function will be used ( default )
#> -> predict survival function : stepfun based on predict.rfsrc()$survival will be used ( default )
#> -> predict cumulative hazard function : stepfun based on predict.rfsrc()$chf will be used ( default )
#> -> model_info : package randomForestSRC , ver. 3.2.3 , task survival ( default )
#> A new explainer has been created!
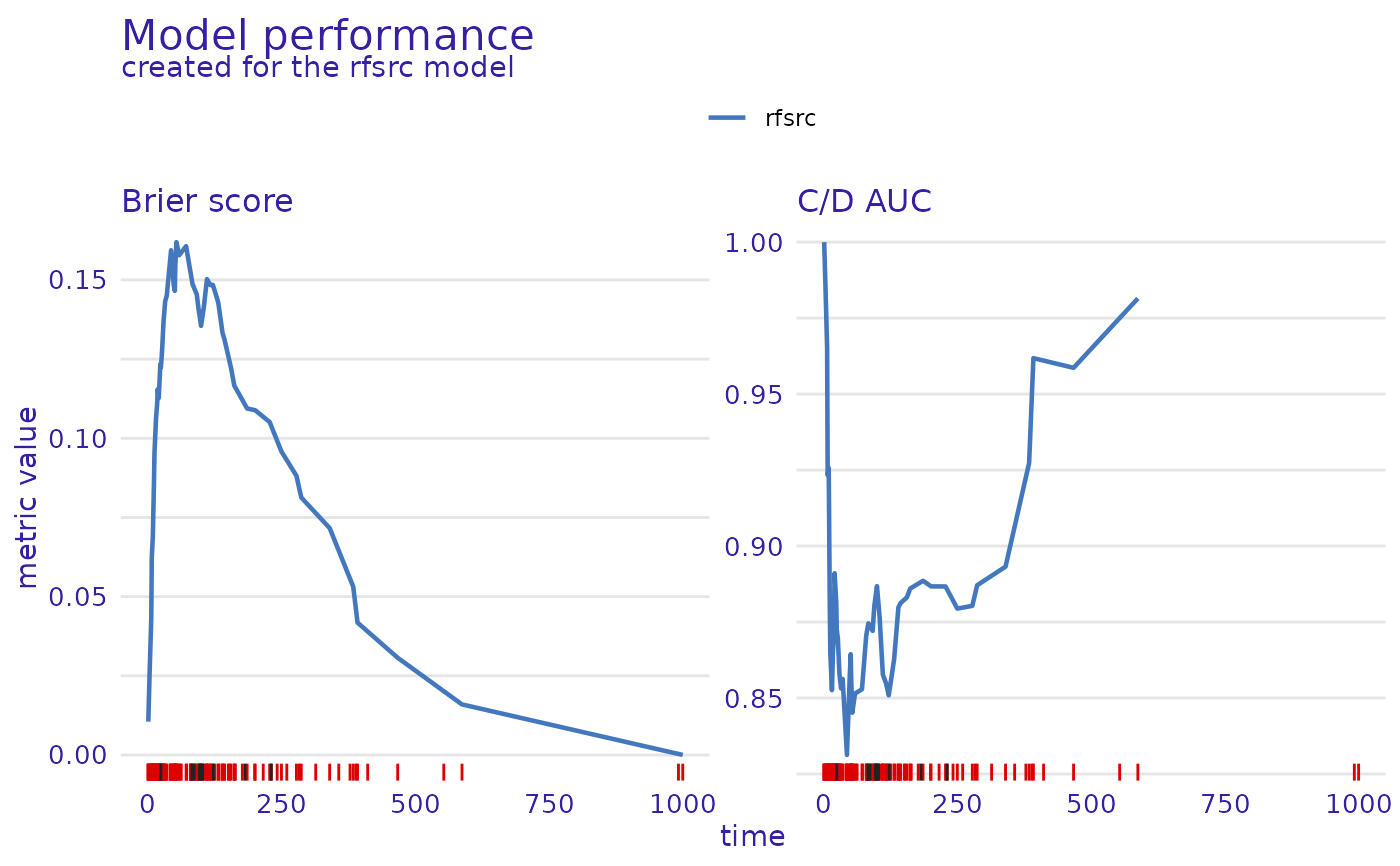
m_perf <- model_performance(exp)
plot(m_perf, metrics_type = "functional")
#> Warning: Removed 1 row containing missing values or values outside the scale range
#> (`geom_line()`).
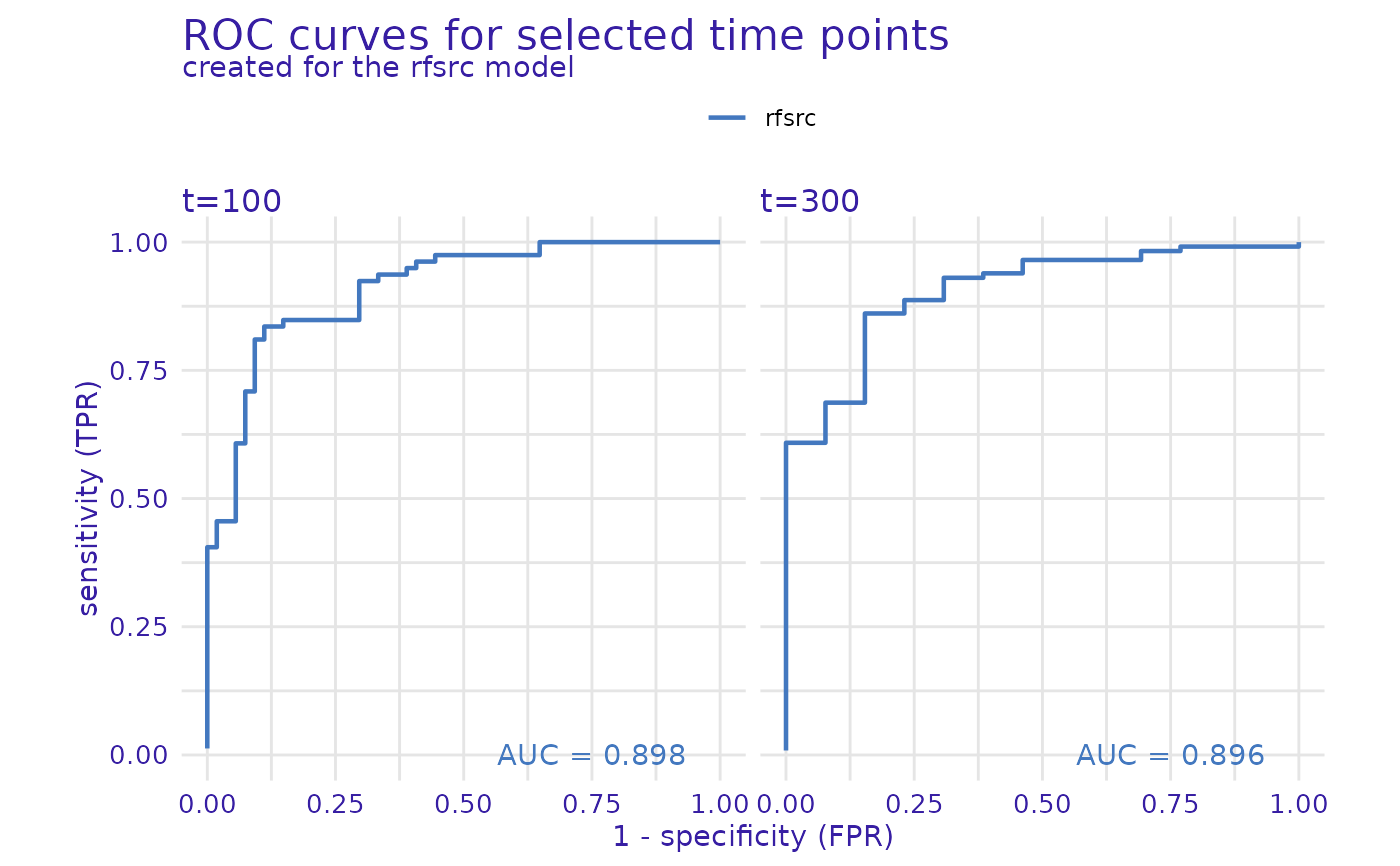
 m_perf_roc <- model_performance(exp, type = "roc", times = c(100, 300))
plot(m_perf_roc)
m_perf_roc <- model_performance(exp, type = "roc", times = c(100, 300))
plot(m_perf_roc)
 # }
# }