Dataset Level Variable Profile as Partial Dependence Explanations for Survival Models
Source:R/model_profile.R
model_profile.surv_explainer.RdThis function calculates explanations on a dataset level that help explore model response as a function of selected variables. The explanations are calculated as an extension of Partial Dependence Profiles with the inclusion of the time dimension.
model_profile(
  explainer,
  variables = NULL,
  N = 100,
  ...,
  groups = NULL,
  k = NULL,
  type = "partial",
  center = FALSE,
  output_type = "survival"
)

# S3 method for surv_explainer
model_profile(
  explainer,
  variables = NULL,
  N = 100,
  ...,
  categorical_variables = NULL,
  grid_points = 51,
  variable_splits_type = "uniform",
  groups = NULL,
  k = NULL,
  center = FALSE,
  type = "partial",
  output_type = "survival"
)
Arguments
- explainer
an explainer object - model preprocessed by the
explain()function- variables
character, a vector of names of variables to be explained
- N
number of observations used for the calculation of aggregated profiles. By default
100. IfNULLall observations are used.- ...
other parameters passed to
DALEX::model_profileifoutput_type == "risk", otherwise ignored- groups
if
output_type == "risk"a variable name that will be used for grouping. By defaultNULL, so no groups are calculated. Ifoutput_type == "survival"then ignored- k
passed to
DALEX::model_profileifoutput_type == "risk", otherwise ignored- type
the type of variable profile,
"partial"for Partial Dependence,"accumulated"for Accumulated Local Effects, or"conditional"(available only foroutput_type == "risk")- center
logical, should profiles be centered around the average prediction
- output_type
either
"survival","chf"or"risk"the type of survival model output that should be considered for explanations. If"survival"the explanations are based on the survival function. If"chf"the explanations are based on the cumulative hazard function. Otherwise the scalar risk predictions are used by theDALEX::predict_profilefunction.- categorical_variables
character, a vector of names of additional variables which should be treated as categorical (factors are automatically treated as categorical variables). If it contains variable names not present in the
variablesargument, they will be added at the end.- grid_points
maximum number of points for profile calculations. Note that the final number of points may be lower than grid_points. Will be passed to internal function. By default
51.- variable_splits_type
character, decides how variable grids should be calculated. Use
"quantiles"for percentiles or"uniform"(default) to get uniform grid of points.
Value
An object of class model_profile_survival. It is a list with the element result containing the results of the calculation.
Examples
# \donttest{
library(survival)
library(survex)
cph <- coxph(Surv(time, status) ~ ., data = veteran, model = TRUE, x = TRUE, y = TRUE)
rsf_src <- randomForestSRC::rfsrc(Surv(time, status) ~ ., data = veteran)
cph_exp <- explain(cph)
#> Preparation of a new explainer is initiated
#> -> model label : coxph ( default )
#> -> data : 137 rows 6 cols ( extracted from the model )
#> -> target variable : 137 values ( 128 events and 9 censored , censoring rate = 0.066 ) ( extracted from the model )
#> -> times : 50 unique time points , min = 1.5 , median survival time = 80 , max = 999
#> -> times : ( generated from y as uniformly distributed survival quantiles based on Kaplan-Meier estimator )
#> -> predict function : predict.coxph with type = 'risk' will be used ( default )
#> -> predict survival function : predictSurvProb.coxph will be used ( default )
#> -> predict cumulative hazard function : -log(predict_survival_function) will be used ( default )
#> -> model_info : package survival , ver. 3.7.0 , task survival ( default )
#> A new explainer has been created!
rsf_src_exp <- explain(rsf_src)
#> Preparation of a new explainer is initiated
#> -> model label : rfsrc ( default )
#> -> data : 137 rows 6 cols ( extracted from the model )
#> -> target variable : 137 values ( 128 events and 9 censored , censoring rate = 0.066 ) ( extracted from the model )
#> -> times : 50 unique time points , min = 1.5 , median survival time = 80 , max = 999
#> -> times : ( generated from y as uniformly distributed survival quantiles based on Kaplan-Meier estimator )
#> -> predict function : sum over the predict_cumulative_hazard_function will be used ( default )
#> -> predict survival function : stepfun based on predict.rfsrc()$survival will be used ( default )
#> -> predict cumulative hazard function : stepfun based on predict.rfsrc()$chf will be used ( default )
#> -> model_info : package randomForestSRC , ver. 3.2.3 , task survival ( default )
#> A new explainer has been created!
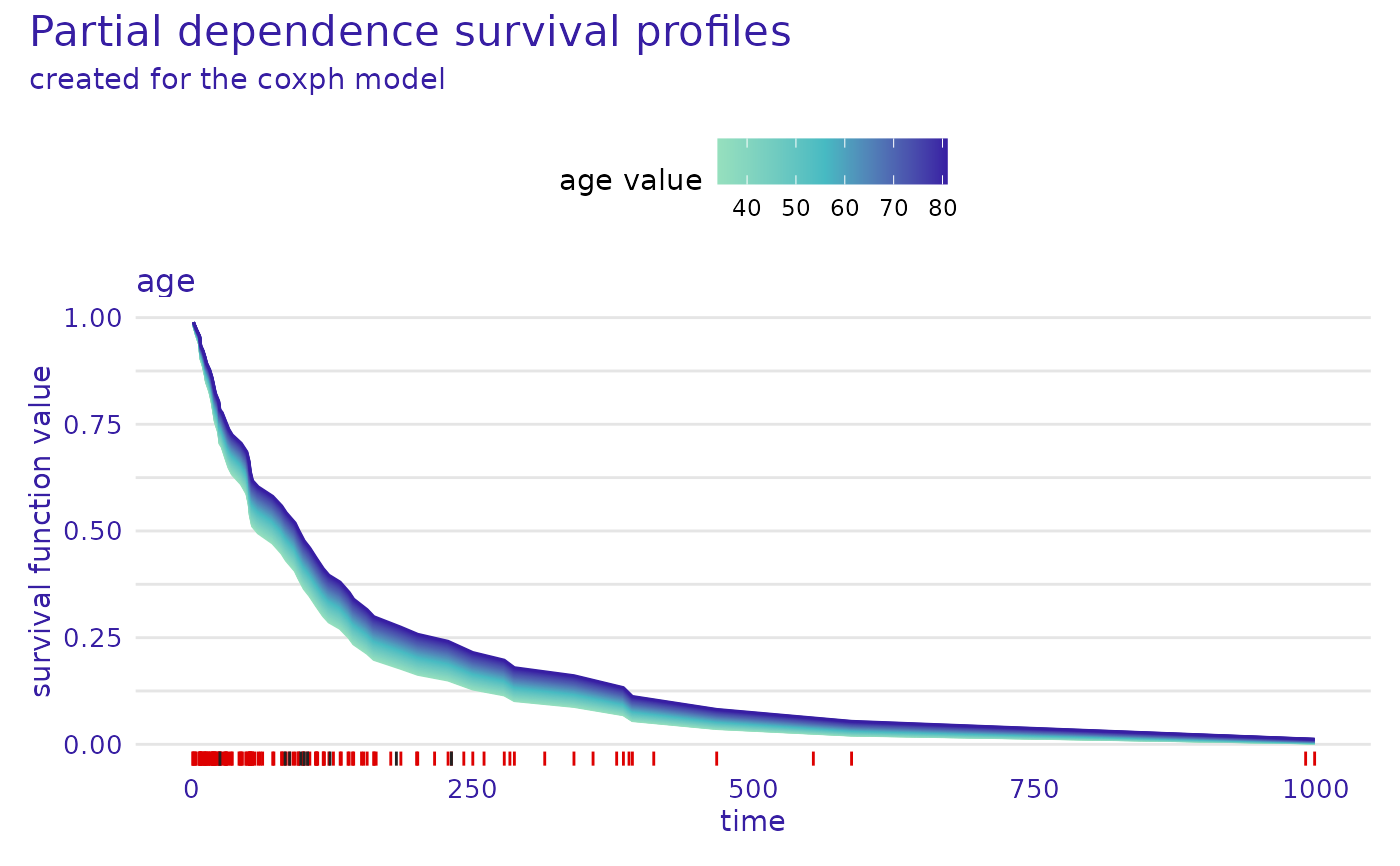
cph_model_profile <- model_profile(cph_exp,
output_type = "survival",
variables = c("age")
)
head(cph_model_profile$result)
#> _vname_ _vtype_ _label_ _x_ _times_ _yhat_ _ids_
#> 1 age numerical coxph 34.00 1.5 0.9840125 0
#> 2 age numerical coxph 34.94 1.5 0.9841410 0
#> 3 age numerical coxph 35.00 1.5 0.9841492 0
#> 4 age numerical coxph 35.88 1.5 0.9842684 0
#> 5 age numerical coxph 36.82 1.5 0.9843949 0
#> 6 age numerical coxph 37.00 1.5 0.9844190 0
plot(cph_model_profile)
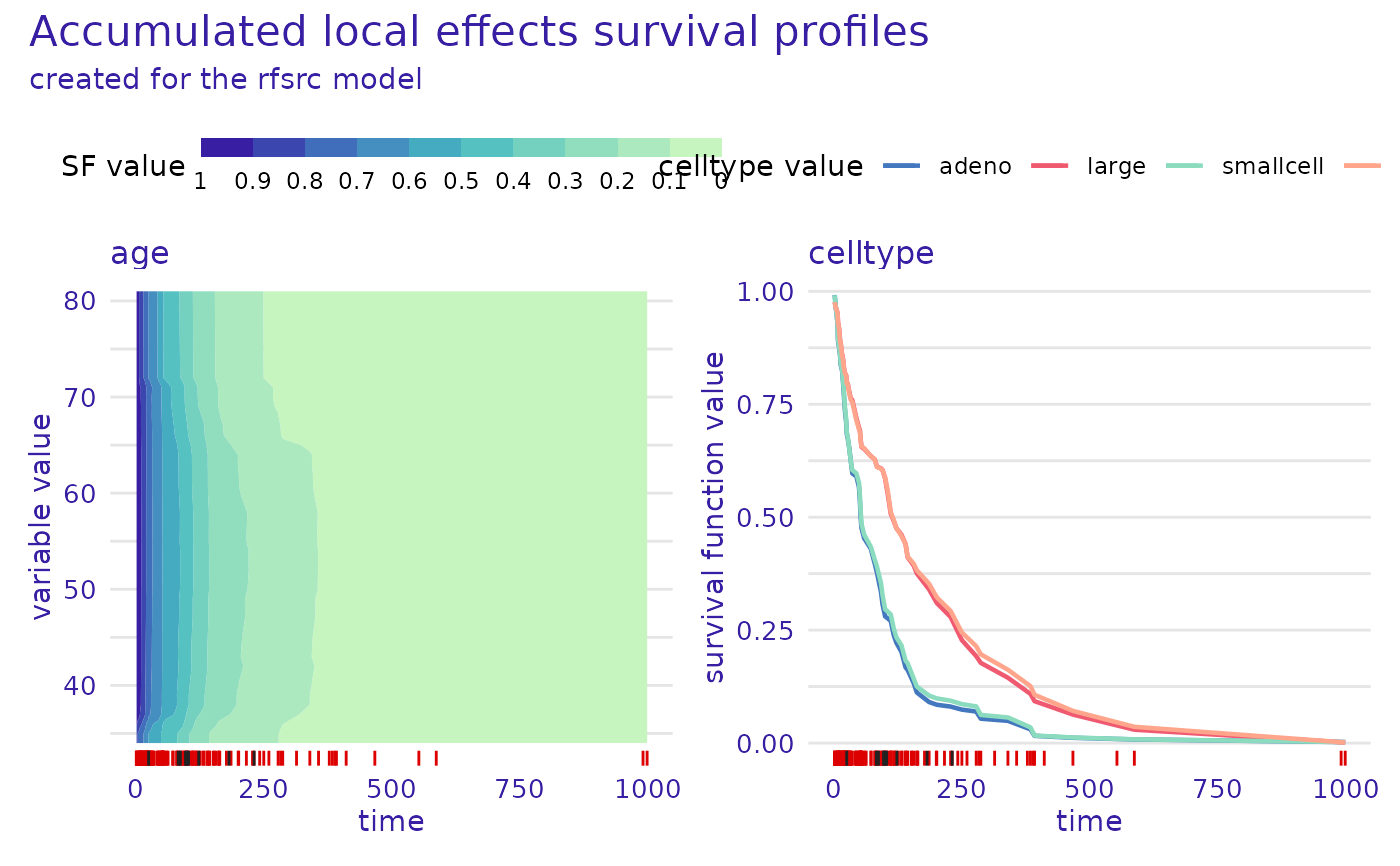
 rsf_model_profile <- model_profile(rsf_src_exp,
output_type = "survival",
variables = c("age", "celltype"),
type = "accumulated"
)
head(rsf_model_profile$result)
#> _vname_ _vtype_ _label_ _x_ _times_ _yhat_ _ids_
#> 1 age numerical rfsrc 34 1.5 0.8541533 0
#> 2 age numerical rfsrc 34 4.0 0.7929659 0
#> 3 age numerical rfsrc 34 7.0 0.7756136 0
#> 4 age numerical rfsrc 34 8.0 0.7516203 0
#> 5 age numerical rfsrc 34 10.0 0.7406234 0
#> 6 age numerical rfsrc 34 12.0 0.7260259 0
plot(rsf_model_profile, variables = c("age", "celltype"), numerical_plot_type = "contours")
rsf_model_profile <- model_profile(rsf_src_exp,
output_type = "survival",
variables = c("age", "celltype"),
type = "accumulated"
)
head(rsf_model_profile$result)
#> _vname_ _vtype_ _label_ _x_ _times_ _yhat_ _ids_
#> 1 age numerical rfsrc 34 1.5 0.8541533 0
#> 2 age numerical rfsrc 34 4.0 0.7929659 0
#> 3 age numerical rfsrc 34 7.0 0.7756136 0
#> 4 age numerical rfsrc 34 8.0 0.7516203 0
#> 5 age numerical rfsrc 34 10.0 0.7406234 0
#> 6 age numerical rfsrc 34 12.0 0.7260259 0
plot(rsf_model_profile, variables = c("age", "celltype"), numerical_plot_type = "contours")
 # }
# }