This is an aesthetically efficient implementation of the
grid.arrange
bind_plots(..., byrow = FALSE)Arguments
- ...
(
ggplot) ggplot objects to combine.- byrow
(
logical) ifFALSE(the default) the plots are bind by columns, otherwise the plots are bind by rows.
Value
(gtable) A plottable object with plot().
Examples
# \donttest{
library("DALEX")
library("ingredients")
titanic_glm <- glm(survived ~ gender + age + fare,
data = titanic_imputed, family = "binomial")
explain_glm <- explain(titanic_glm,
data = titanic_imputed,
y = titanic_imputed$survived,
verbose = FALSE)
pdp_numerical <- partial_dependence(explain_glm, N = 50, variable_type = "numerical")
pdp_categorical <- partial_dependence(explain_glm, N = 50, variable_type = "categorical")
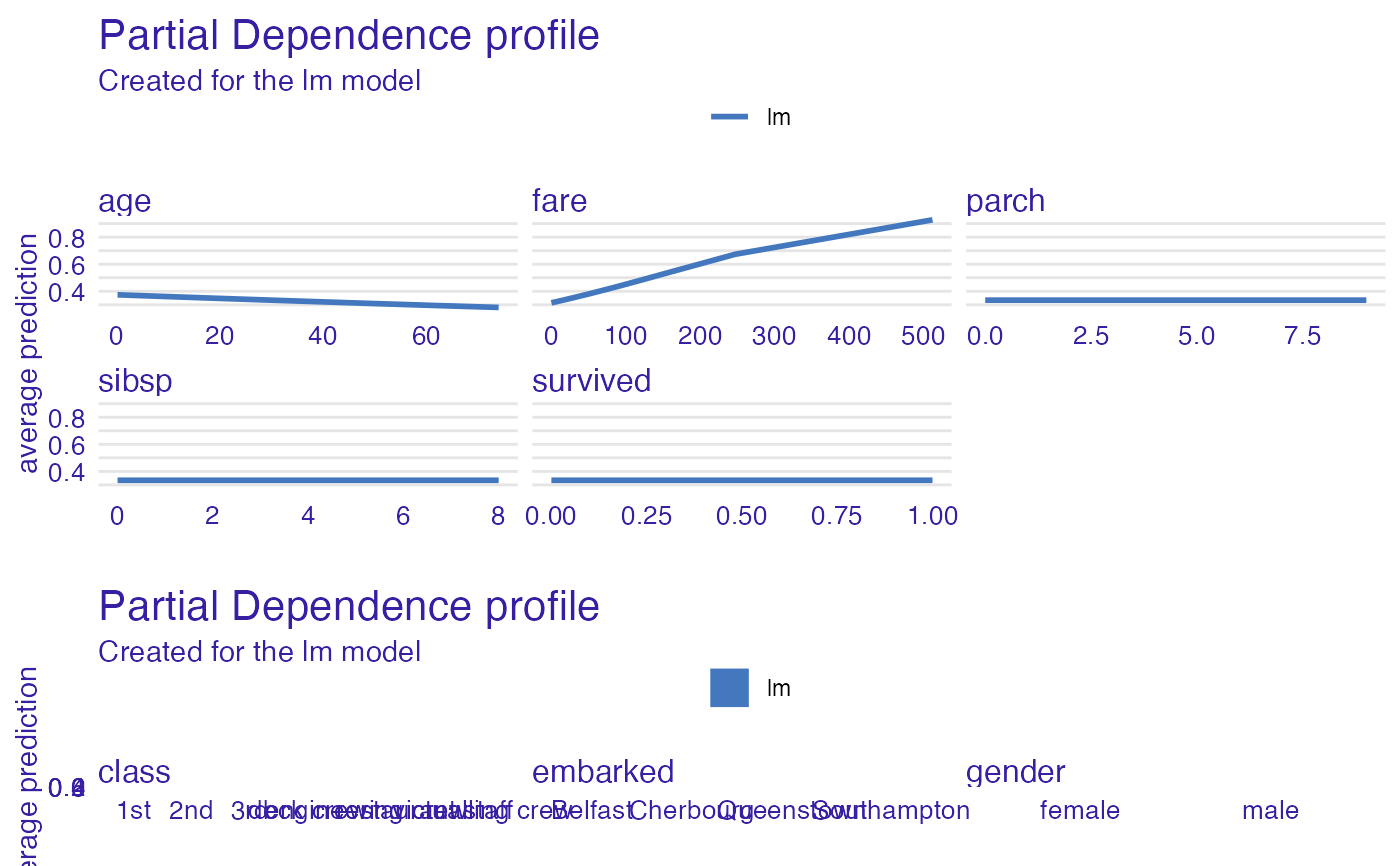
# Bind plots by rows
bind_plots(plot(pdp_numerical), plot(pdp_categorical), byrow = TRUE)
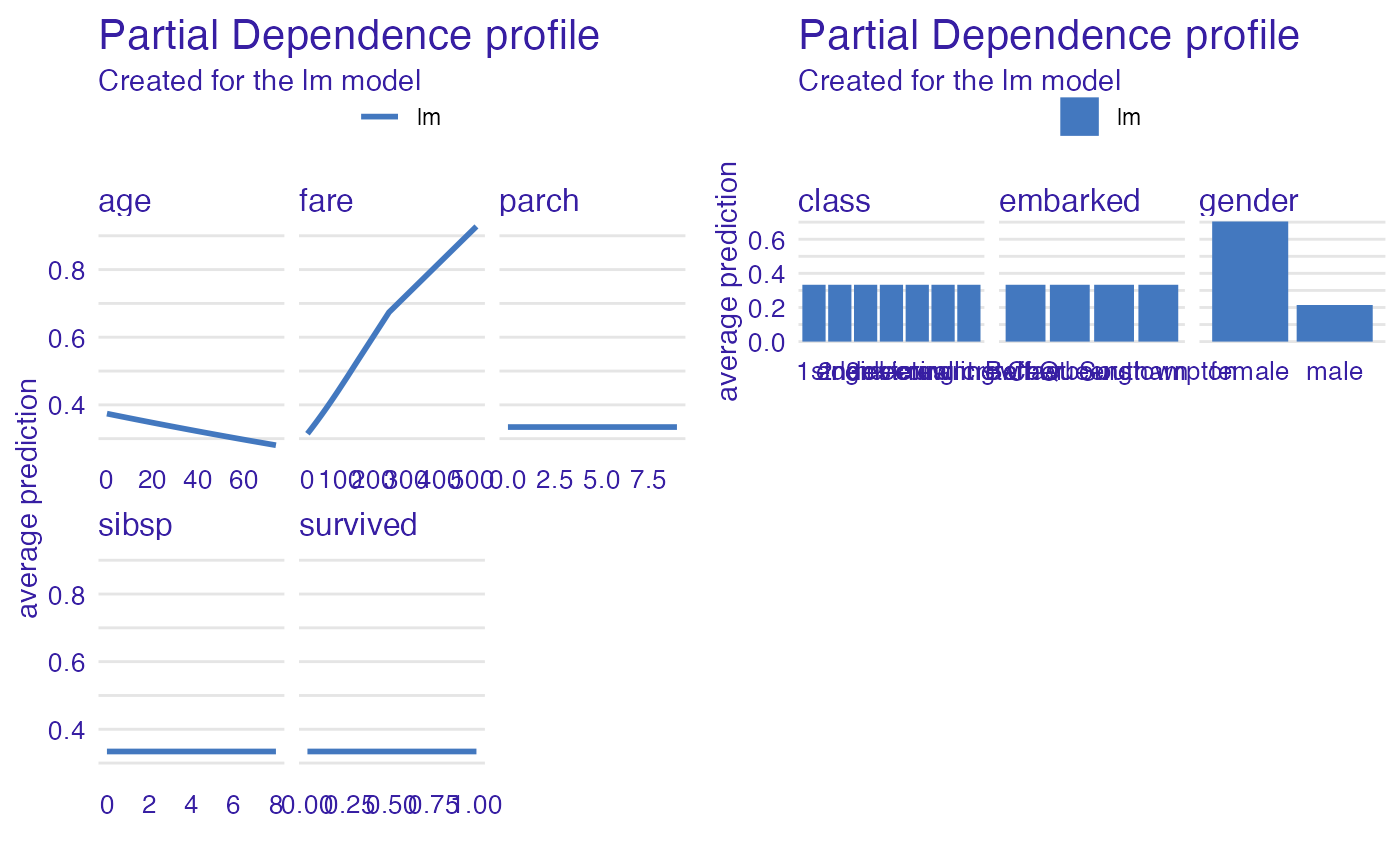
 # Bind plots by columns
bind_plots(plot(pdp_numerical), plot(pdp_categorical), byrow = FALSE)
# Bind plots by columns
bind_plots(plot(pdp_numerical), plot(pdp_categorical), byrow = FALSE)
 # }
# }