Plot Global Variable Importance measure
Source:R/plot_global_importance.R
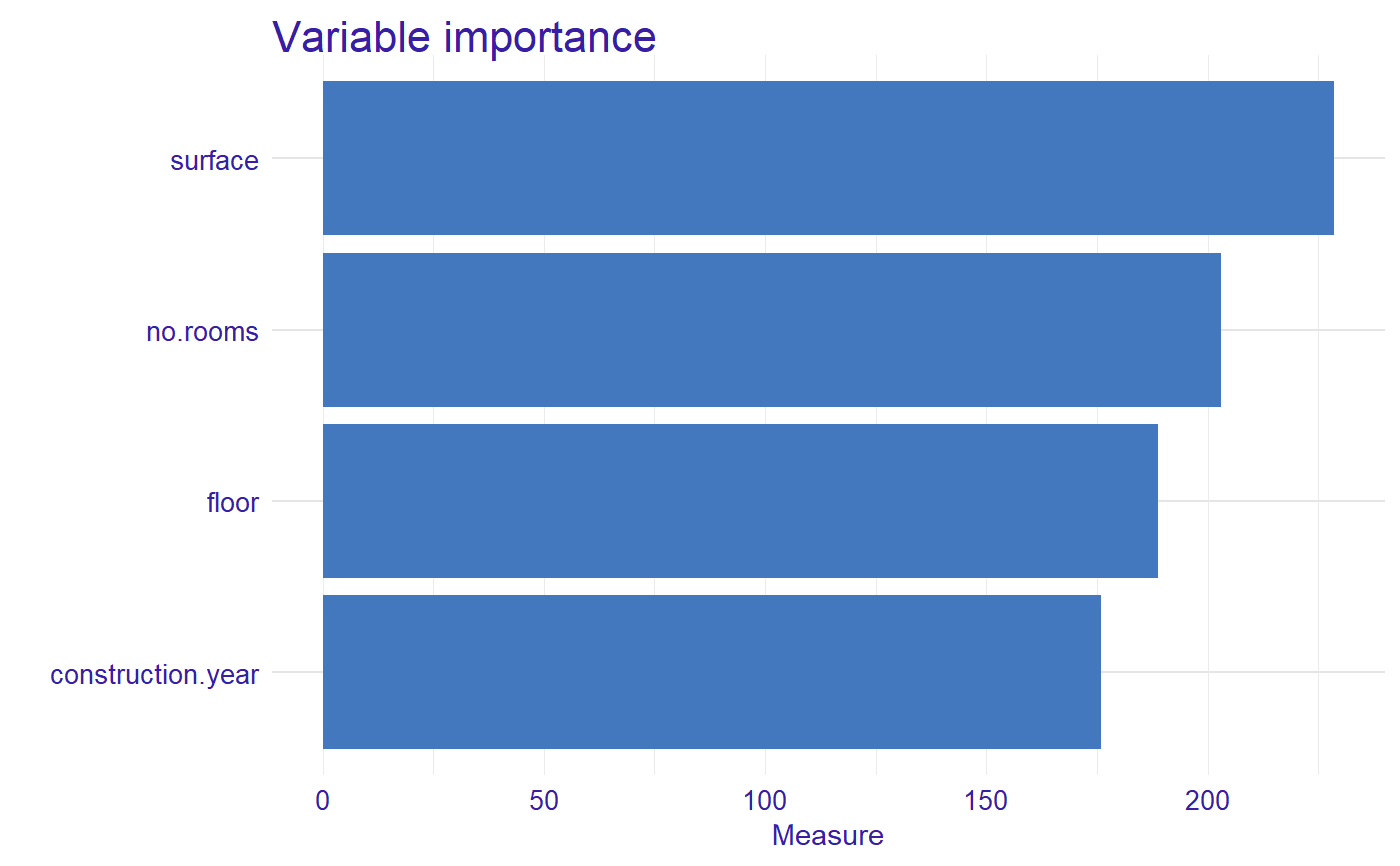
plot.global_importance.RdFunction plot.global_importance plots global importance measure based on Partial Dependence profiles.
# S3 method for global_importance
plot(x, ..., variables = NULL, type = NULL, title = "Variable importance")
Arguments
| x | object returned from |
|---|---|
| ... | other object returned from |
| variables | if not |
| type | a character. How variables shall be plotted? Either "bars" (default) or "lines". |
| title | the plot's title, by default |
Value
a ggplot2 object
Examples
library("DALEX") data(apartments) library("randomForest") apartments_rf_model <- randomForest(m2.price ~ construction.year + surface + floor + no.rooms, data = apartments) explainer_rf <- explain(apartments_rf_model, data = apartmentsTest[,2:5], y = apartmentsTest$m2.price)#> Preparation of a new explainer is initiated #> -> model label : randomForest ( default ) #> -> data : 9000 rows 4 cols #> -> target variable : 9000 values #> -> predict function : yhat.randomForest will be used ( default ) #> -> predicted values : numerical, min = 2106.103 , mean = 3516.09 , max = 5283.956 #> -> model_info : package randomForest , ver. 4.6.14 , task regression ( default ) #> -> residual function : difference between y and yhat ( default ) #> -> residuals : numerical, min = -1260.225 , mean = -4.566031 , max = 2160.703 #> A new explainer has been created!profiles <- model_profile(explainer_rf) library("vivo") measure <- global_variable_importance(profiles) plot(measure)