Convert your tree-based model into a standardized representation.
The returned representation is easy to be interpreted by the user and ready to be used as an argument in treeshap() function.
unify(model, data, ...)Arguments
- model
A tree-based model object of any supported class (
gbm,lgb.Booster,randomForest,ranger, orxgb.Booster).- data
Reference dataset. A
data.frameormatrixwith the same columns as in the training set of the model. Usually dataset used to train model.- ...
Additional parameters passed to the model-specific unification functions.
Value
A unified model representation - a model_unified.object object (for single-output models) or model_unified_multioutput.object, which is a list of model_unified.object objects (for multi-output models).
See also
Examples
if (
requireNamespace("ranger", quietly = TRUE) &&
requireNamespace("randomForest", quietly = TRUE)
) {
library(ranger)
data_fifa <- fifa20$data[
!colnames(fifa20$data) %in%
c(
'work_rate',
'value_eur',
'gk_diving',
'gk_handling',
'gk_kicking',
'gk_reflexes',
'gk_speed',
'gk_positioning'
)
]
data <- na.omit(cbind(data_fifa, target = fifa20$target))
rf1 <- ranger::ranger(target ~ ., data = data, max.depth = 10, num.trees = 10)
unified_model1 <- unify(rf1, data)
shaps1 <- treeshap(unified_model1, data[1:2, ])
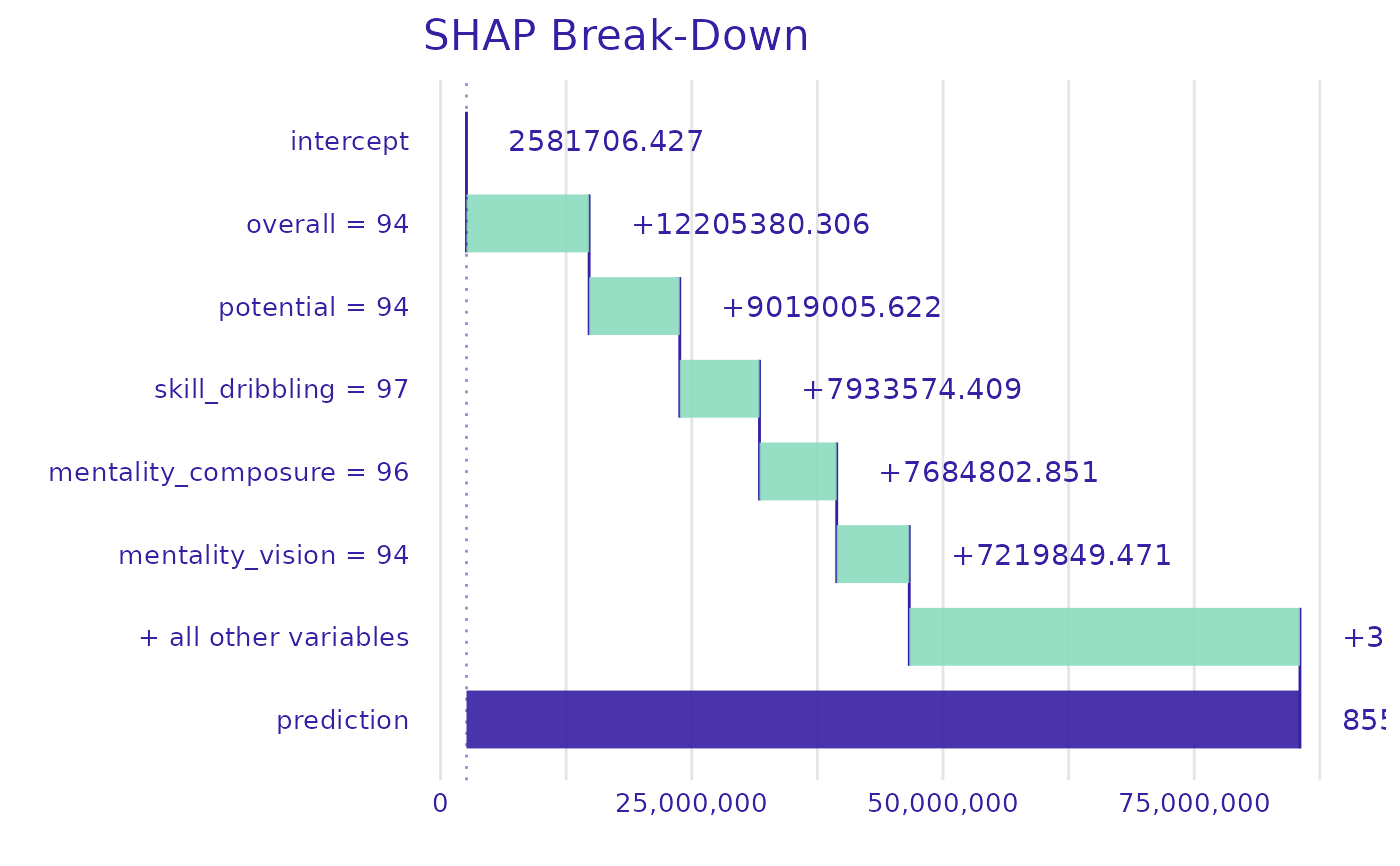
plot_contribution(shaps1, obs = 1)
rf2 <- randomForest::randomForest(
target ~ .,
data = data,
maxnodes = 10,
ntree = 10
)
unified_model2 <- unify(rf2, data)
shaps2 <- treeshap(unified_model2, data[1:2, ])
plot_contribution(shaps2, obs = 1)
}
#>
|0%----|------|20%---|------|40%---|------|60%---|------|80%---|------|100%
#> =---------------------------------------------------------------------- (0%)
====================================----------------------------------- (50%)
======================================================================= (100%)