Plot Predict Parts for Survival Models
Source:R/plot_predict_parts_survival.R
plot.predict_parts_survival.RdThis function plots objects of class "predict_parts_survival" - local explanations
for survival models created using the predict_parts() function.
# S3 method for predict_parts_survival
plot(x, ...)
Arguments
- x
an object of class
"predict_parts_survival"to be plotted- ...
additional parameters passed to the
plot.surv_shaporplot.surv_limefunctions
Value
An object of the class ggplot.
Plot options
plot.surv_shap
x- an object of class"surv_shap"to be plotted...- additional objects of classsurv_shapto be plotted togethertitle- character, title of the plotsubtitle- character, subtitle of the plot,'default'automatically generates "created for XXX, YYY models", where XXX and YYY are the explainer labelsmax_vars- maximum number of variables to be plotted (least important variables are ignored)colors- character vector containing the colors to be used for plotting variables (containing either hex codes "#FF69B4", or names "blue")rug- character, one of"all","events","censors","none"orNULL. Which times to mark on the x axis ingeom_rug().rug_colors- character vector containing two colors (containing either hex codes "#FF69B4", or names "blue"). The first color (red by default) will be used to mark event times, whereas the second (grey by default) will be used to mark censor times.
plot.surv_lime
x- an object of class"surv_lime"to be plottedtype- character, either "coefficients" or "local_importance", selects the type of plotshow_survival_function- logical, if the survival function of the explanations should be plotted next to the barplot...- other parameters currently ignoredtitle- character, title of the plotsubtitle- character, subtitle of the plot,'default'automatically generates "created for XXX, YYY models", where XXX and YYY are the explainer labelsmax_vars- maximum number of variables to be plotted (least important variables are ignored)colors- character vector containing the colors to be used for plotting variables (containing either hex codes "#FF69B4", or names "blue")
See also
Other functions for plotting 'predict_parts_survival' objects:
plot.surv_lime(),
plot.surv_shap()
Examples
# \donttest{
library(survival)
library(survex)
model <- randomForestSRC::rfsrc(Surv(time, status) ~ ., data = veteran)
exp <- explain(model)
#> Preparation of a new explainer is initiated
#> -> model label : rfsrc ( default )
#> -> data : 137 rows 6 cols ( extracted from the model )
#> -> target variable : 137 values ( 128 events and 9 censored , censoring rate = 0.066 ) ( extracted from the model )
#> -> times : 50 unique time points , min = 1.5 , median survival time = 80 , max = 999
#> -> times : ( generated from y as uniformly distributed survival quantiles based on Kaplan-Meier estimator )
#> -> predict function : sum over the predict_cumulative_hazard_function will be used ( default )
#> -> predict survival function : stepfun based on predict.rfsrc()$survival will be used ( default )
#> -> predict cumulative hazard function : stepfun based on predict.rfsrc()$chf will be used ( default )
#> -> model_info : package randomForestSRC , ver. 3.2.3 , task survival ( default )
#> A new explainer has been created!
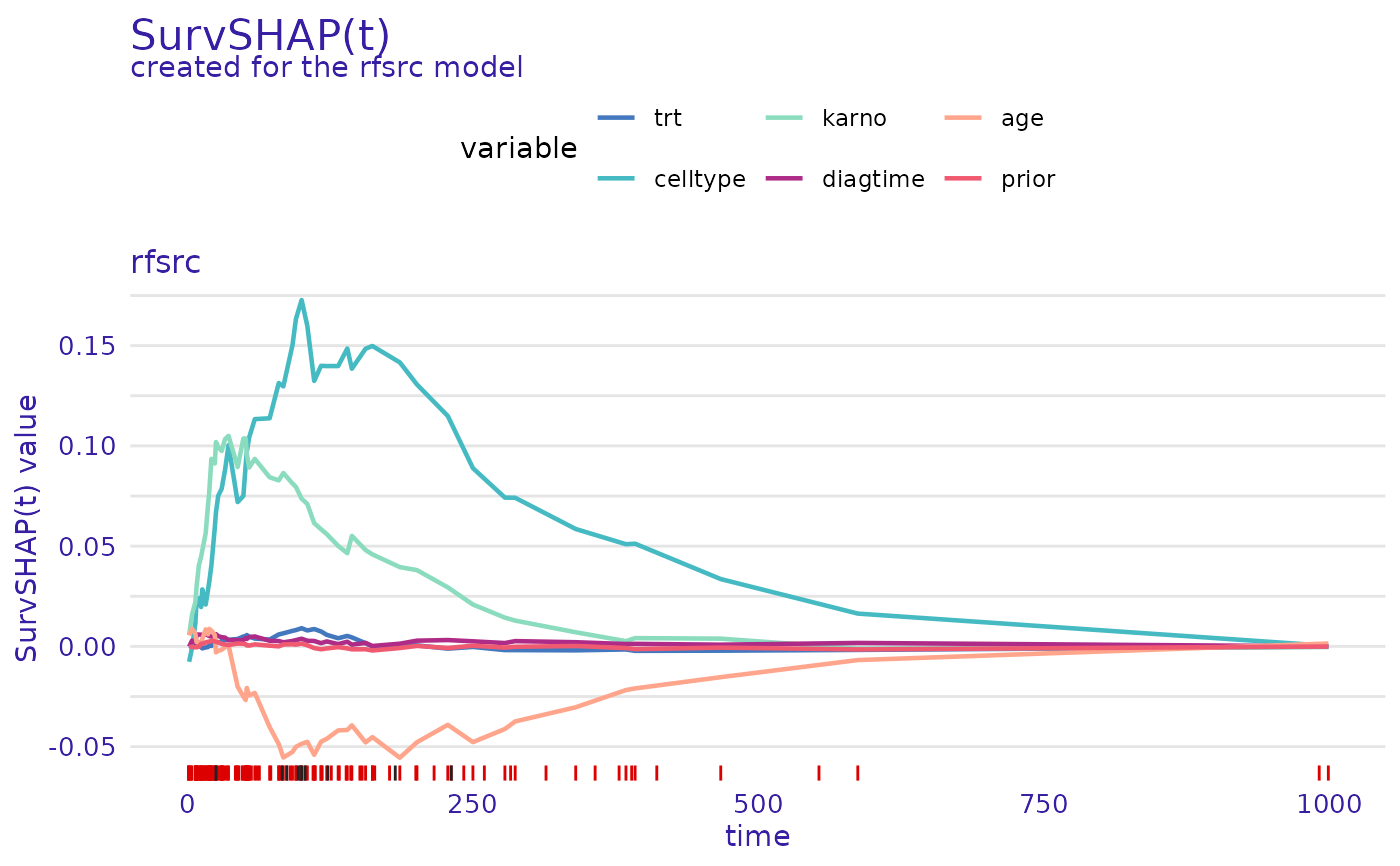
p_parts_shap <- predict_parts(exp, veteran[1, -c(3, 4)], type = "survshap")
plot(p_parts_shap)
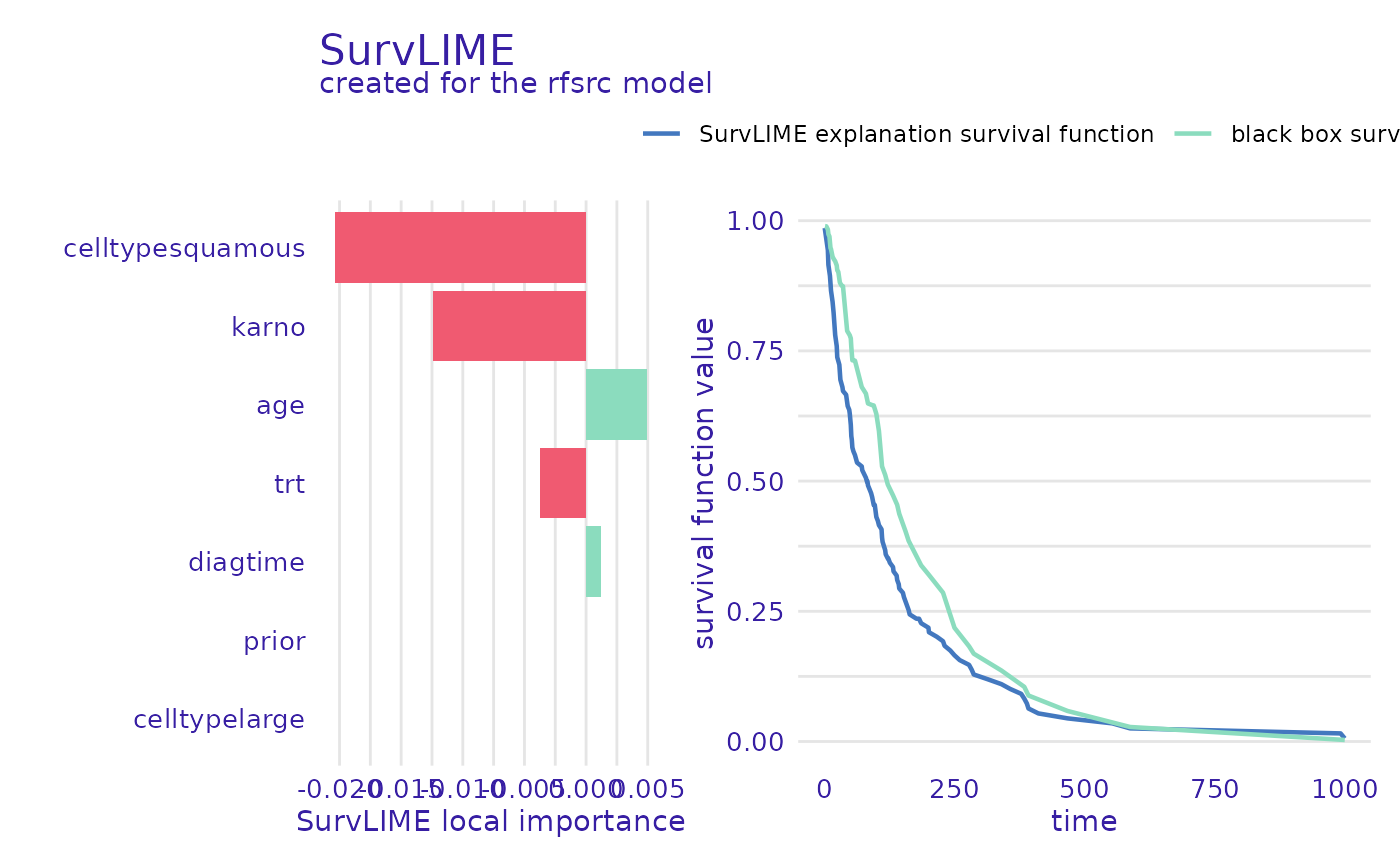
 p_parts_lime <- predict_parts(exp, veteran[1, -c(3, 4)], type = "survlime")
plot(p_parts_lime)
p_parts_lime <- predict_parts(exp, veteran[1, -c(3, 4)], type = "survlime")
plot(p_parts_lime)
 # }
# }