Plot Ceteris Paribus Oscillations
Source:R/plot_ceteris_paribus_oscillations.R
plot.ceteris_paribus_oscillations.RdThis function plots local variable importance plots calculated as oscillations in the Ceteris Paribus Profiles.
# S3 method for ceteris_paribus_oscillations
plot(x, ..., bar_width = 10)
Arguments
- x
a ceteris paribus oscillation explainer produced with function
calculate_oscillations()- ...
other explainers that shall be plotted together
- bar_width
width of bars. By default
10.
Value
a ggplot2 object
References
Explanatory Model Analysis. Explore, Explain, and Examine Predictive Models. https://ema.drwhy.ai/
Examples
# \donttest{
library("DALEX")
library("ranger")
apartments_rf_model <- ranger(m2.price ~., data = apartments)
explainer_rf <- explain(apartments_rf_model,
data = apartments_test[,-1],
y = apartments_test[,1],
label = "ranger forest",
verbose = FALSE)
apartment <- apartments_test[1:2,]
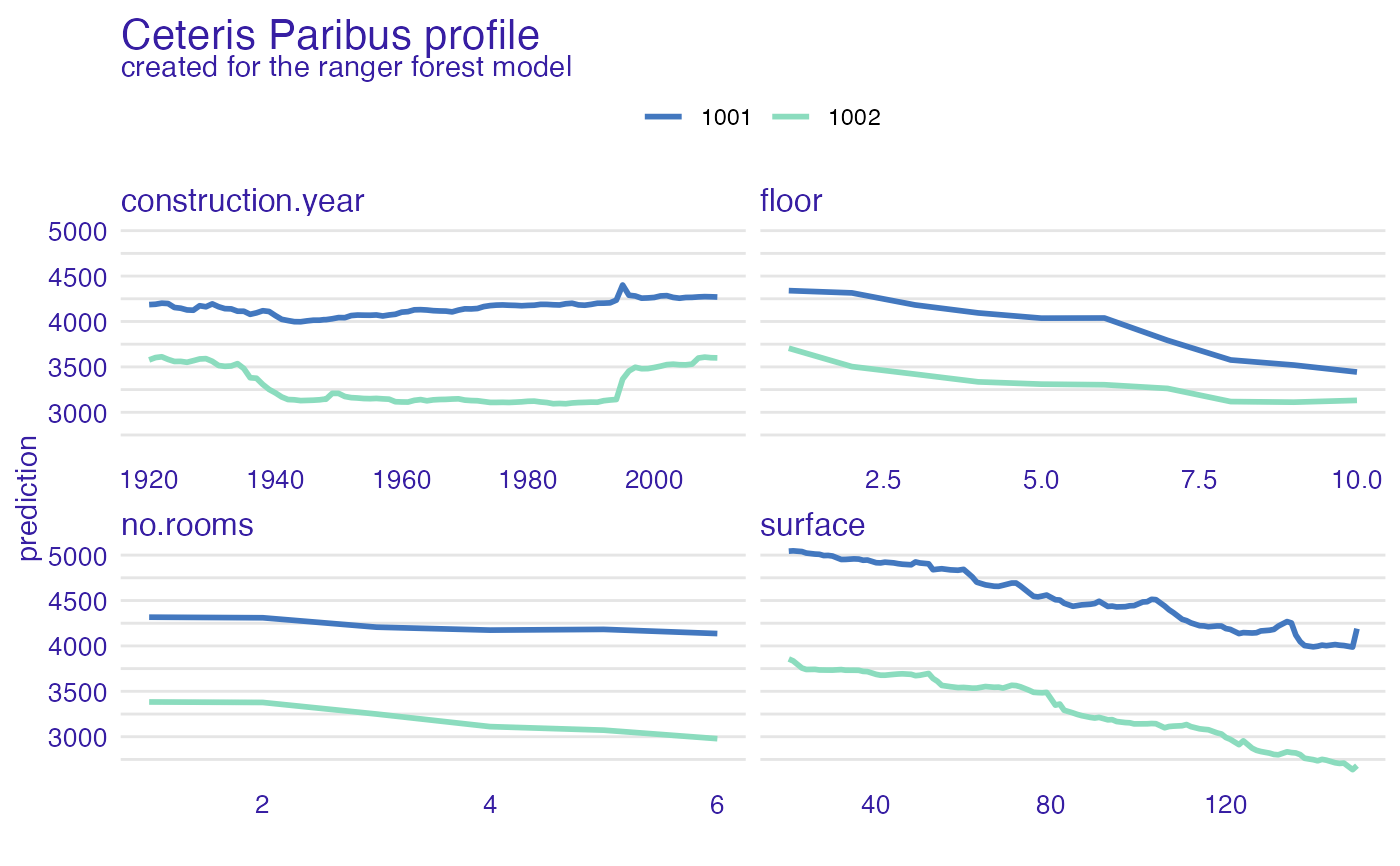
cp_rf <- ceteris_paribus(explainer_rf, apartment)
plot(cp_rf, color = "_ids_")
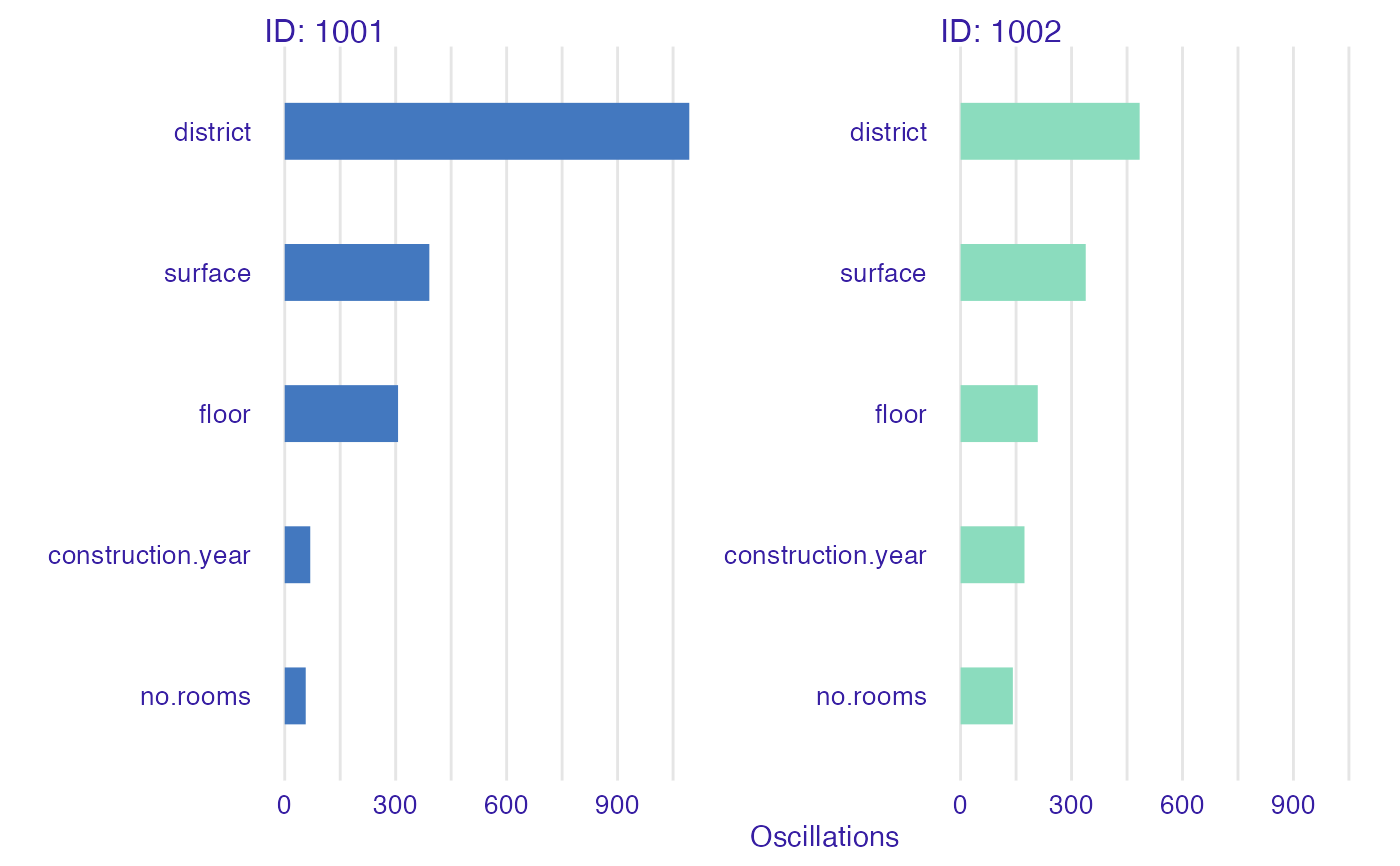
 vips <- calculate_oscillations(cp_rf)
vips
#> _vname_ _ids_ oscillations
#> 9 district 1001 1093.86759
#> 10 district 1002 484.11913
#> 3 surface 1001 391.00242
#> 4 surface 1002 338.37753
#> 5 floor 1001 306.45497
#> 6 floor 1002 208.64971
#> 2 construction.year 1002 172.77975
#> 8 no.rooms 1002 141.31555
#> 1 construction.year 1001 69.04783
#> 7 no.rooms 1001 56.80458
plot(vips)
vips <- calculate_oscillations(cp_rf)
vips
#> _vname_ _ids_ oscillations
#> 9 district 1001 1093.86759
#> 10 district 1002 484.11913
#> 3 surface 1001 391.00242
#> 4 surface 1002 338.37753
#> 5 floor 1001 306.45497
#> 6 floor 1002 208.64971
#> 2 construction.year 1002 172.77975
#> 8 no.rooms 1002 141.31555
#> 1 construction.year 1001 69.04783
#> 7 no.rooms 1001 56.80458
plot(vips)
 # }
# }