SHAP value based Feature Importance plot
Source:R/plot_feature_importance.R
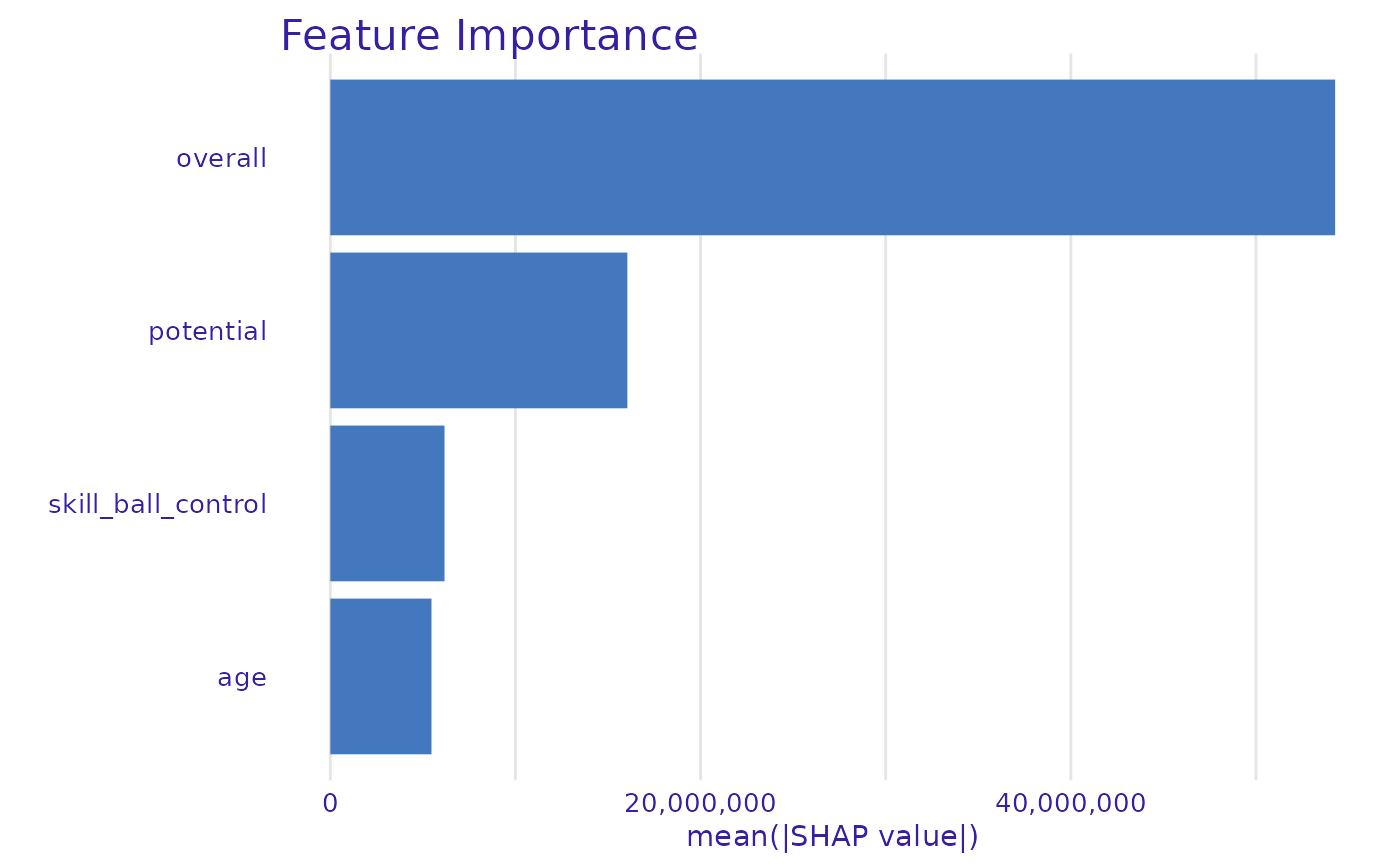
plot_feature_importance.RdThis function plots feature importance calculated as means of absolute values of SHAP values of variables (average impact on model output magnitude).
plot_feature_importance(
  treeshap,
  desc_sorting = TRUE,
  max_vars = ncol(shaps),
  title = "Feature Importance",
  subtitle = NULL
)
Arguments
- treeshap
A treeshap object produced with the
treeshapfunction.treeshap.object.- desc_sorting
logical. Should the bars be sorted descending? By default TRUE.
- max_vars
maximum number of variables that shall be presented. By default all are presented.
- title
the plot's title, by default
'Feature Importance'.- subtitle
the plot's subtitle. By default no subtitle.
Value
a ggplot2 object
See also
treeshap for calculation of SHAP values
plot_contribution, plot_feature_dependence, plot_interaction
Examples
# \donttest{
if (requireNamespace("xgboost", quietly = TRUE) &&
 requireNamespace("scales", quietly = TRUE)) {
  library(xgboost)
  data <- fifa20$data[colnames(fifa20$data) != 'work_rate']
  target <- fifa20$target
  xgb_model <- xgboost::xgboost(
   x = as.matrix(data),
   y = target,
   objective = "reg:squarederror",
   max_depth = 3,
   nrounds = 20,
   nthreads = 1
  )
  unified_model <- xgboost.unify(xgb_model, as.matrix(data))
  shaps <- treeshap(unified_model, as.matrix(head(data, 3)))
  plot_feature_importance(shaps, max_vars = 4)
}# }
#>
|0%----|------|20%---|------|40%---|------|60%---|------|80%---|------|100%
#> =---------------------------------------------------------------------- (0%)

========================----------------------------------------------- (33%)

===============================================------------------------ (66%)

======================================================================= (100%)