Plot Permutational Feature Importance for Survival Models
Source:R/plot_surv_feature_importance.R
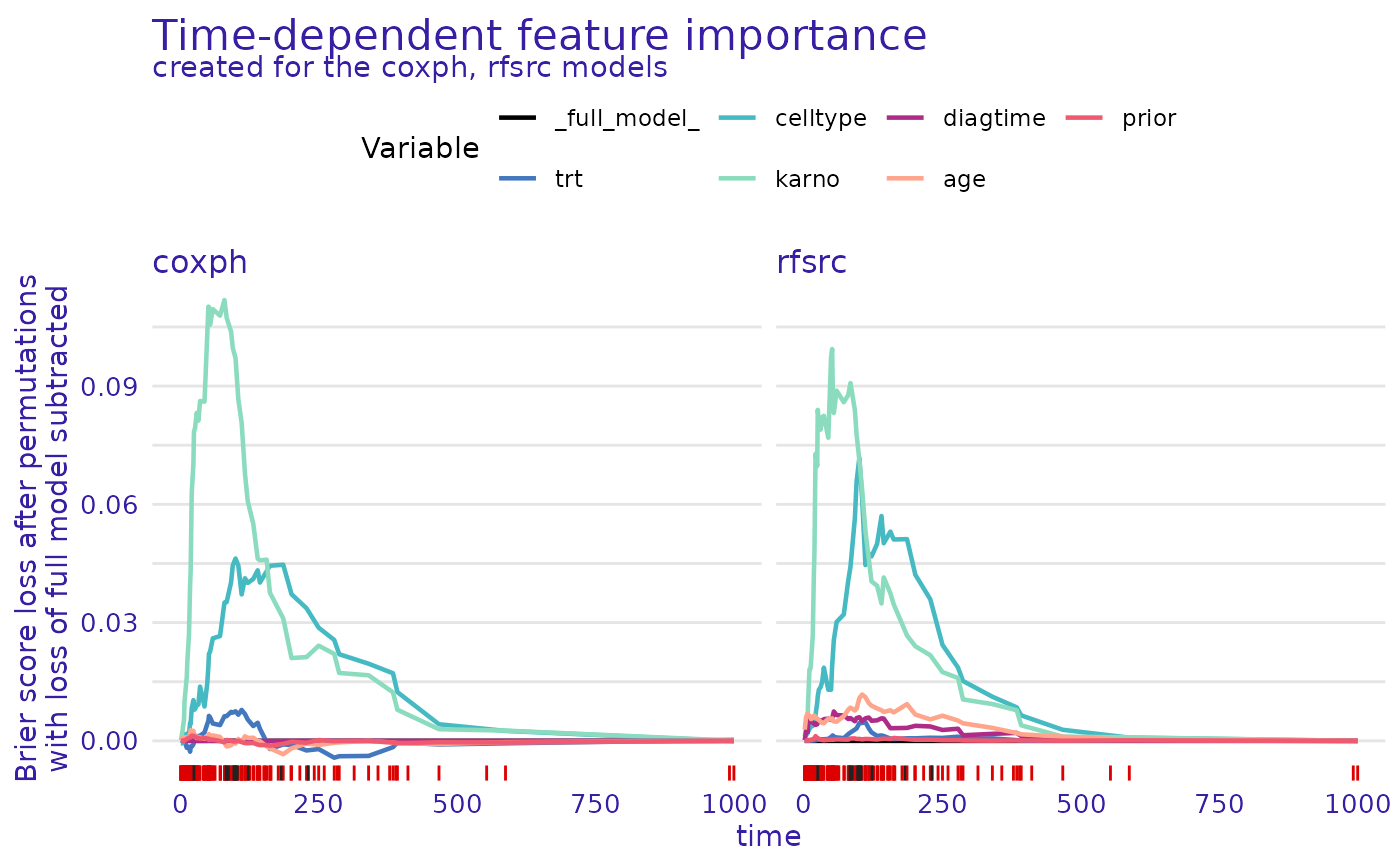
plot.surv_feature_importance.RdThis function plots feature importance objects created for survival models using the
model_parts() function with a time-dependent metric, that is loss_one_minus_cd_auc() or
loss_brier_score().
Arguments
- x
an object of class
"surv_feature_importance"to be plotted- ...
additional objects of class
"surv_feature_importance"to be plotted together- title
character, title of the plot
- subtitle
character, subtitle of the plot,
'default'automatically generates "created for XXX, YYY models", where XXX and YYY are the explainer labels- max_vars
maximum number of variables to be plotted (least important variables are ignored)
- colors
character vector containing the colors to be used for plotting variables (containing either hex codes "#FF69B4", or names "blue")
- rug
character, one of
"all","events","censors","none"orNULL. Which times to mark on the x axis ingeom_rug().- rug_colors
character vector containing two colors (containing either hex codes "#FF69B4", or names "blue"). The first color (red by default) will be used to mark event times, whereas the second (grey by default) will be used to mark censor times.
Value
An object of the class ggplot.
See also
Other functions for plotting 'model_parts_survival' objects:
plot.model_parts_survival()
Examples
# \donttest{
library(survival)
library(survex)

model <- coxph(Surv(time, status) ~ ., data = veteran, x = TRUE, model = TRUE, y = TRUE)
model_rf <- randomForestSRC::rfsrc(Surv(time, status) ~ ., data = veteran)
explainer <- explain(model)
#> Preparation of a new explainer is initiated
#>   -> model label       :  coxph (  default  )
#>   -> data              :  137  rows  6  cols (  extracted from the model  )
#>   -> target variable   :  137  values ( 128 events and 9 censored , censoring rate = 0.066 ) (  extracted from the model  )
#>   -> times             :  50 unique time points , min = 1.5 , median survival time = 80 , max = 999
#>   -> times             :  (  generated from y as uniformly distributed survival quantiles based on Kaplan-Meier estimator  )
#>   -> predict function  :  predict.coxph with type = 'risk' will be used (  default  )
#>   -> predict survival function  :  predictSurvProb.coxph will be used (  default  )
#>   -> predict cumulative hazard function  :  -log(predict_survival_function) will be used (  default  )
#>   -> model_info        :  package survival , ver. 3.7.0 , task survival (  default  )
#>   A new explainer has been created!
explainer_rf <- explain(model_rf)
#> Preparation of a new explainer is initiated
#>   -> model label       :  rfsrc (  default  )
#>   -> data              :  137  rows  6  cols (  extracted from the model  )
#>   -> target variable   :  137  values ( 128 events and 9 censored , censoring rate = 0.066 ) (  extracted from the model  )
#>   -> times             :  50 unique time points , min = 1.5 , median survival time = 80 , max = 999
#>   -> times             :  (  generated from y as uniformly distributed survival quantiles based on Kaplan-Meier estimator  )
#>   -> predict function  :  sum over the predict_cumulative_hazard_function will be used (  default  )
#>   -> predict survival function  :  stepfun based on predict.rfsrc()$survival will be used (  default  )
#>   -> predict cumulative hazard function  :  stepfun based on predict.rfsrc()$chf will be used (  default  )
#>   -> model_info        :  package randomForestSRC , ver. 3.2.3 , task survival (  default  )
#>   A new explainer has been created!

mp <- model_parts(explainer)
mp_rf <- model_parts(explainer_rf)

plot(mp, mp_rf)

# }
# }