Plot Predict Profile for Survival Models
Source:R/plot_predict_profile_survival.R
plot.predict_profile_survival.RdThis function plots objects of class "predict_profile_survival" created using
the predict_profile() function.
# S3 method for predict_profile_survival
plot(
  x,
  ...,
  geom = "time",
  variables = NULL,
  variable_type = NULL,
  facet_ncol = NULL,
  numerical_plot_type = "lines",
  times = NULL,
  marginalize_over_time = FALSE,
  title = "default",
  subtitle = "default",
  colors = NULL,
  rug = "all",
  rug_colors = c("#dd0000", "#222222")
)
Arguments
- x
an object of class
predict_profile_survivalto be plotted- ...
additional objects of class
"predict_profile_survival"to be plotted together. Only available forgeom = "time".- geom
character, either
"time"or"variable". Selects the type of plot to be prepared. If"time"then the x-axis represents survival times, and variable is denoted by colors, if"variable"then the x-axis represents the variable values, and y-axis represents the predictions at selected time points.- variables
character, names of the variables to be plotted. When
geom = "variable"it needs to be a name of a single variable, whengeom = "time"it can be a vector of variable names. IfNULL(default) then first variable (forgeom = "variable") or all variables (forgeom = "time") are plotted.- variable_type
character, either
"numerical","categorical"orNULL(default), select only one type of variable for plotting, or leaveNULLfor all. Only used whengeom = "time".- facet_ncol
number of columns for arranging subplots. Only used when
geom = "time".- numerical_plot_type
character, either
"lines", or"contours"selects the type of numerical variable plots. Only used whengeom = "time".- times
numeric vector, times for which the profile should be plotted, the times must be present in the 'times' field of the explainer. If
NULL(default) then the median survival time (if available) or the median time from the explainer object is used. Only used whengeom = "variable"andmarginalize_over_time = FALSE.- marginalize_over_time
logical, if
TRUEthen the profile is calculated for all times and then averaged over time, ifFALSE(default) then the profile is calculated for each time separately. Only used whengeom = "variable".- title
character, title of the plot
- subtitle
character, subtitle of the plot,
'default'automatically generates "created for XXX, YYY models", where XXX and YYY are the explainer labels- colors
character vector containing the colors to be used for plotting variables (containing either hex codes "#FF69B4", or names "blue")
- rug
character, one of
"all","events","censors","none"orNULL. Which times to mark on the x axis ingeom_rug().- rug_colors
character vector containing two colors (containing either hex codes
"#FF69B4", or names"blue"). The first color (red by default) will be used to mark event times, whereas the second (grey by default) will be used to mark censor times.
Value
A collection of ggplot objects arranged with the patchwork package.
Examples
# \donttest{
library(survival)
library(survex)
model <- randomForestSRC::rfsrc(Surv(time, status) ~ ., data = veteran)
exp <- explain(model)
#> Preparation of a new explainer is initiated
#> -> model label : rfsrc ( default )
#> -> data : 137 rows 6 cols ( extracted from the model )
#> -> target variable : 137 values ( 128 events and 9 censored , censoring rate = 0.066 ) ( extracted from the model )
#> -> times : 50 unique time points , min = 1.5 , median survival time = 80 , max = 999
#> -> times : ( generated from y as uniformly distributed survival quantiles based on Kaplan-Meier estimator )
#> -> predict function : sum over the predict_cumulative_hazard_function will be used ( default )
#> -> predict survival function : stepfun based on predict.rfsrc()$survival will be used ( default )
#> -> predict cumulative hazard function : stepfun based on predict.rfsrc()$chf will be used ( default )
#> -> model_info : package randomForestSRC , ver. 3.2.3 , task survival ( default )
#> A new explainer has been created!
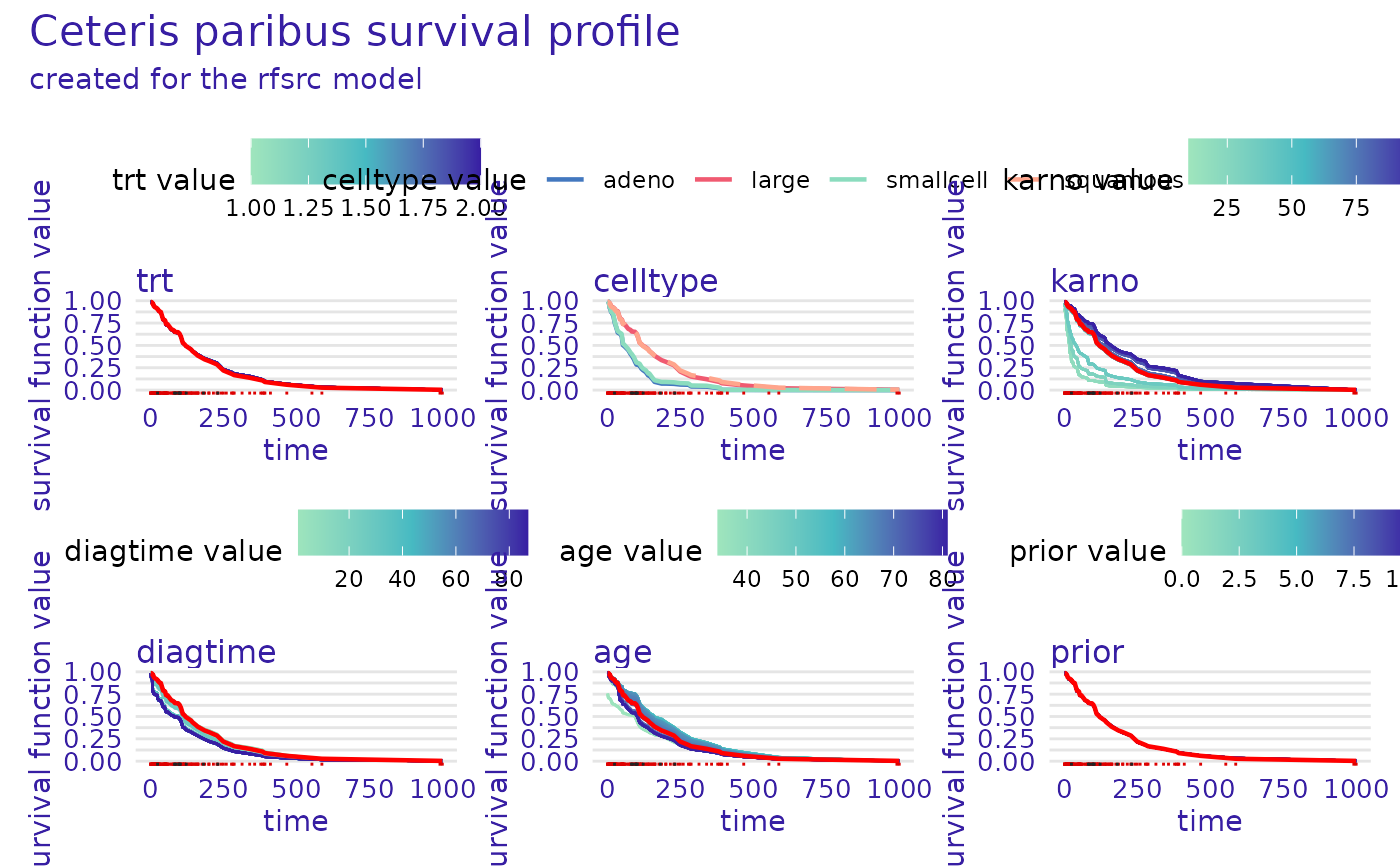
p_profile <- predict_profile(exp, veteran[1, -c(3, 4)])
plot(p_profile)
 p_profile_with_cat <- predict_profile(
exp,
veteran[1, -c(3, 4)],
categorical_variables = c("trt", "prior")
)
plot(p_profile_with_cat)
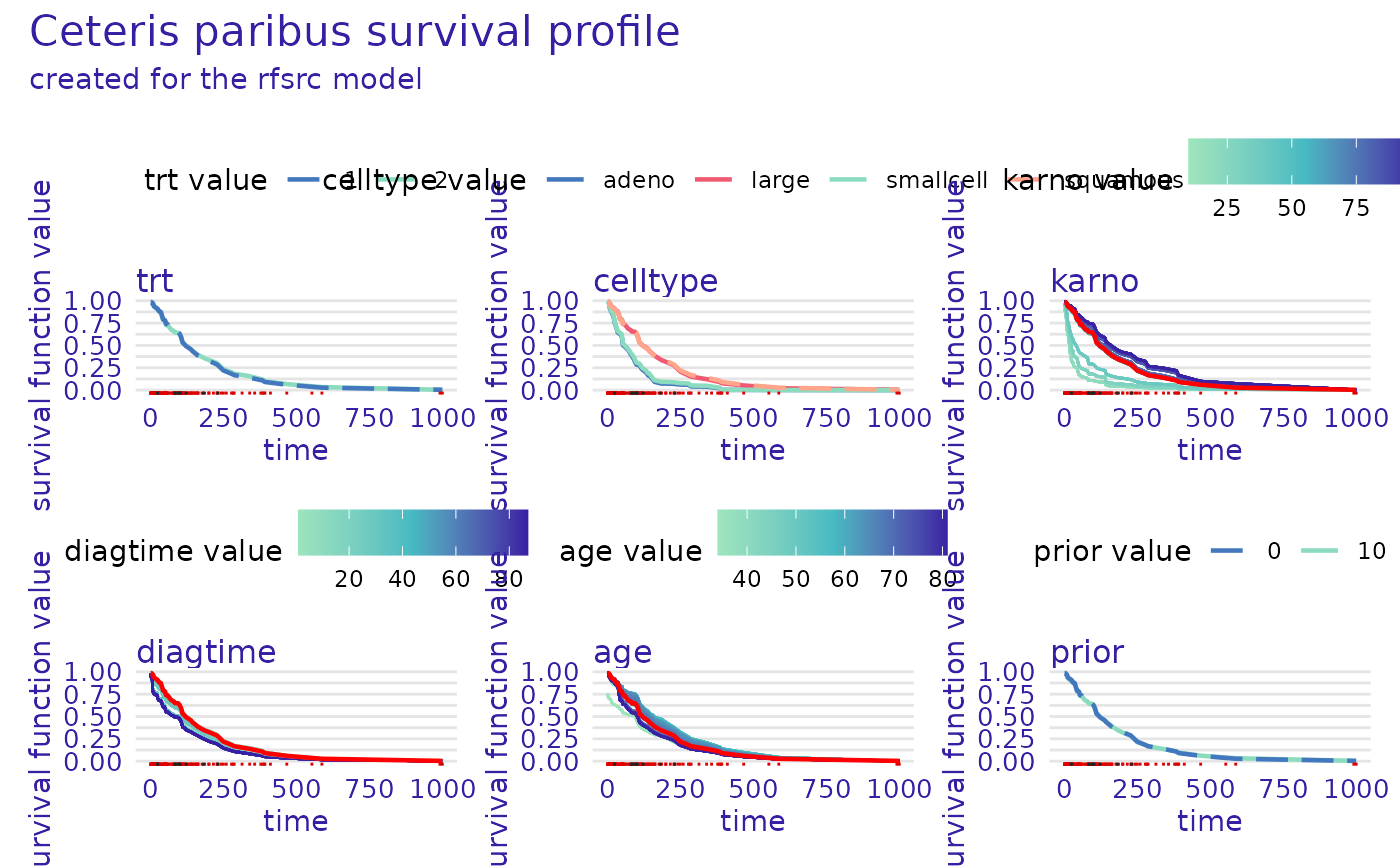
p_profile_with_cat <- predict_profile(
exp,
veteran[1, -c(3, 4)],
categorical_variables = c("trt", "prior")
)
plot(p_profile_with_cat)
 # }
# }