Plot Aggregated SurvSHAP(t) Explanations for Survival Models
Source:R/plot_surv_shap.R
plot.aggregated_surv_shap.RdThis functions plots objects of class aggregated_surv_shap - aggregated time-dependent
explanations of survival models created using the model_survshap() function.
# S3 method for aggregated_surv_shap
plot(
  x,
  geom = "importance",
  ...,
  title = "default",
  subtitle = "default",
  max_vars = 7,
  colors = NULL
)
Arguments
- x
an object of class
aggregated_surv_shapto be plotted- geom
character, one of
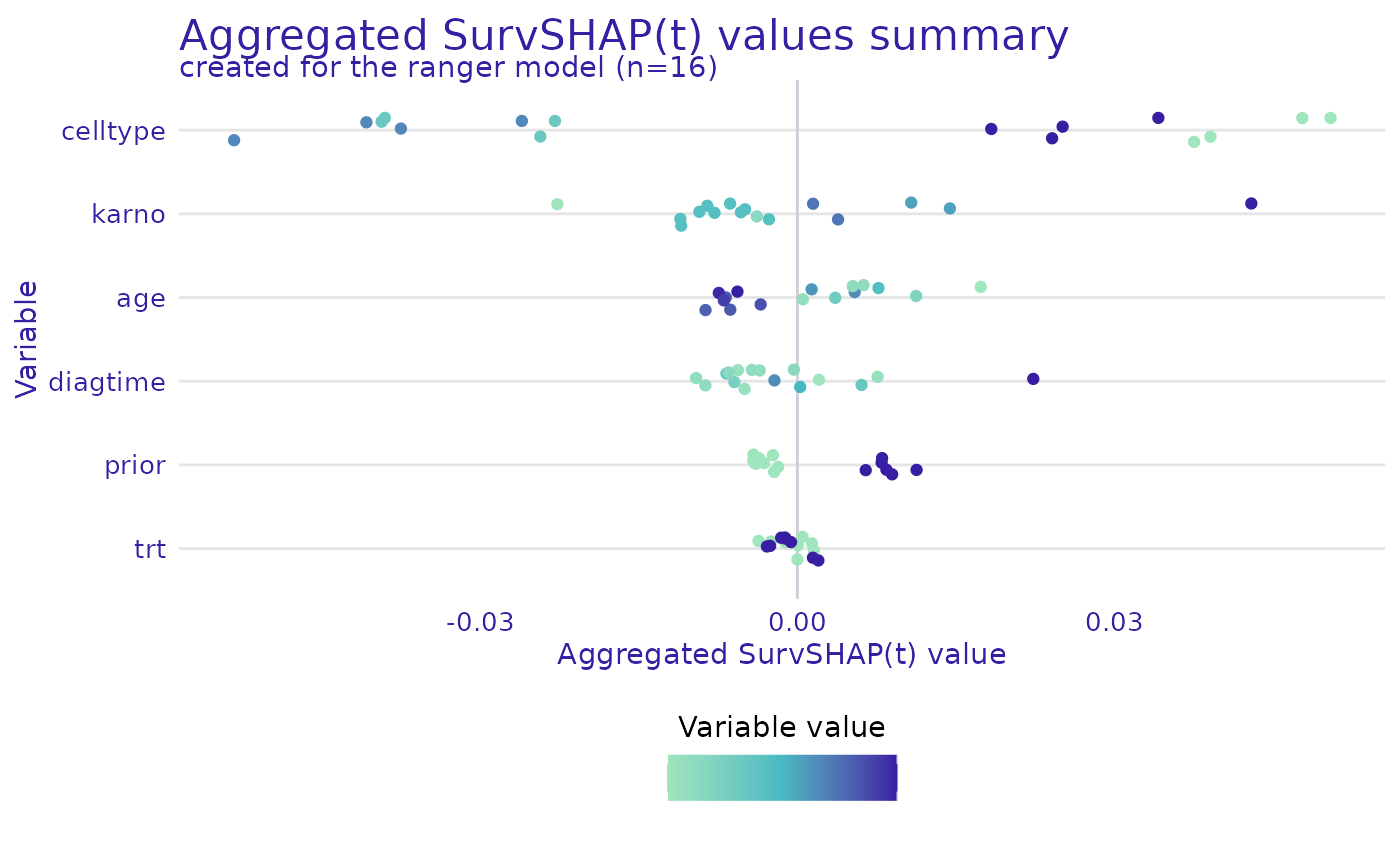
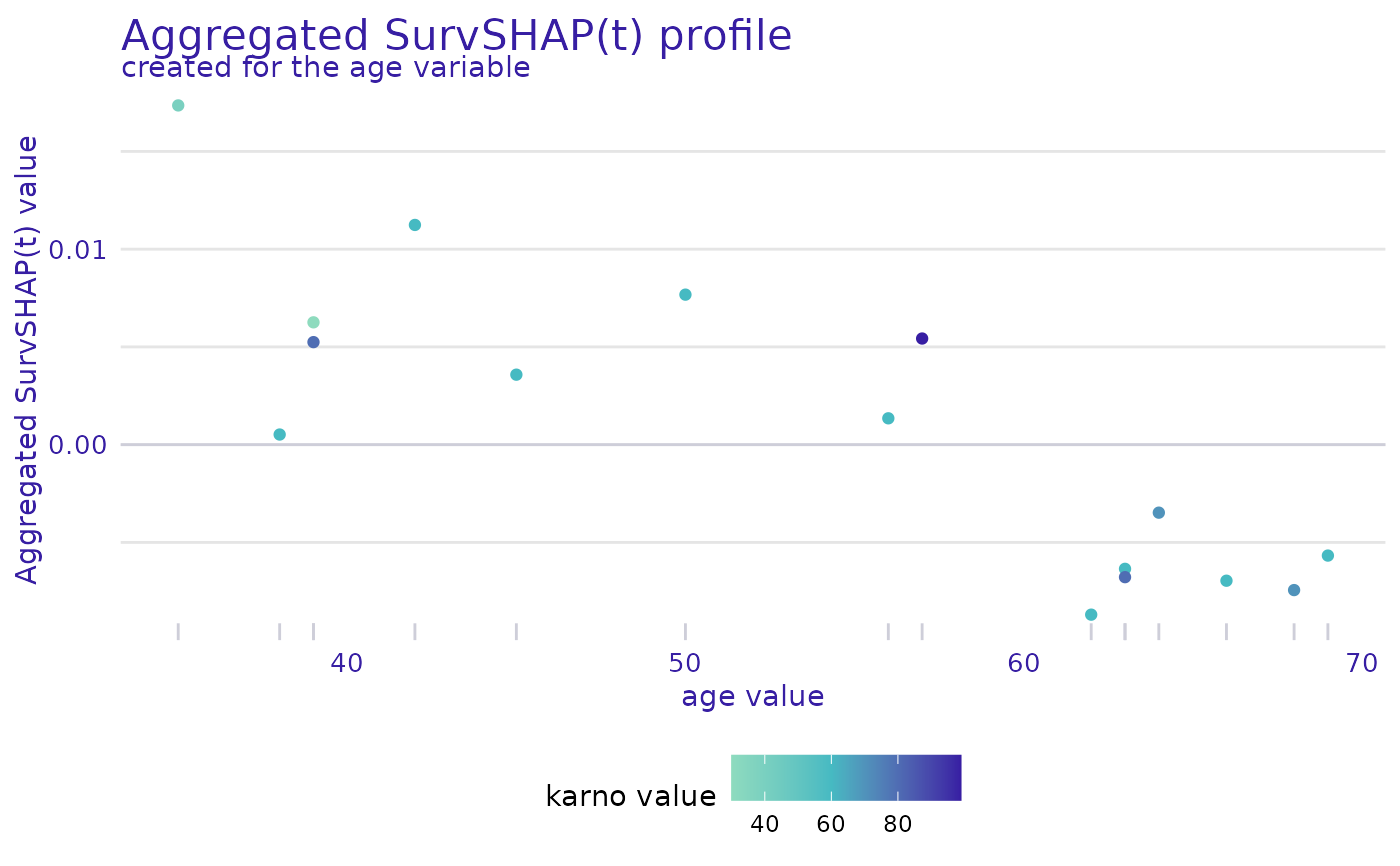
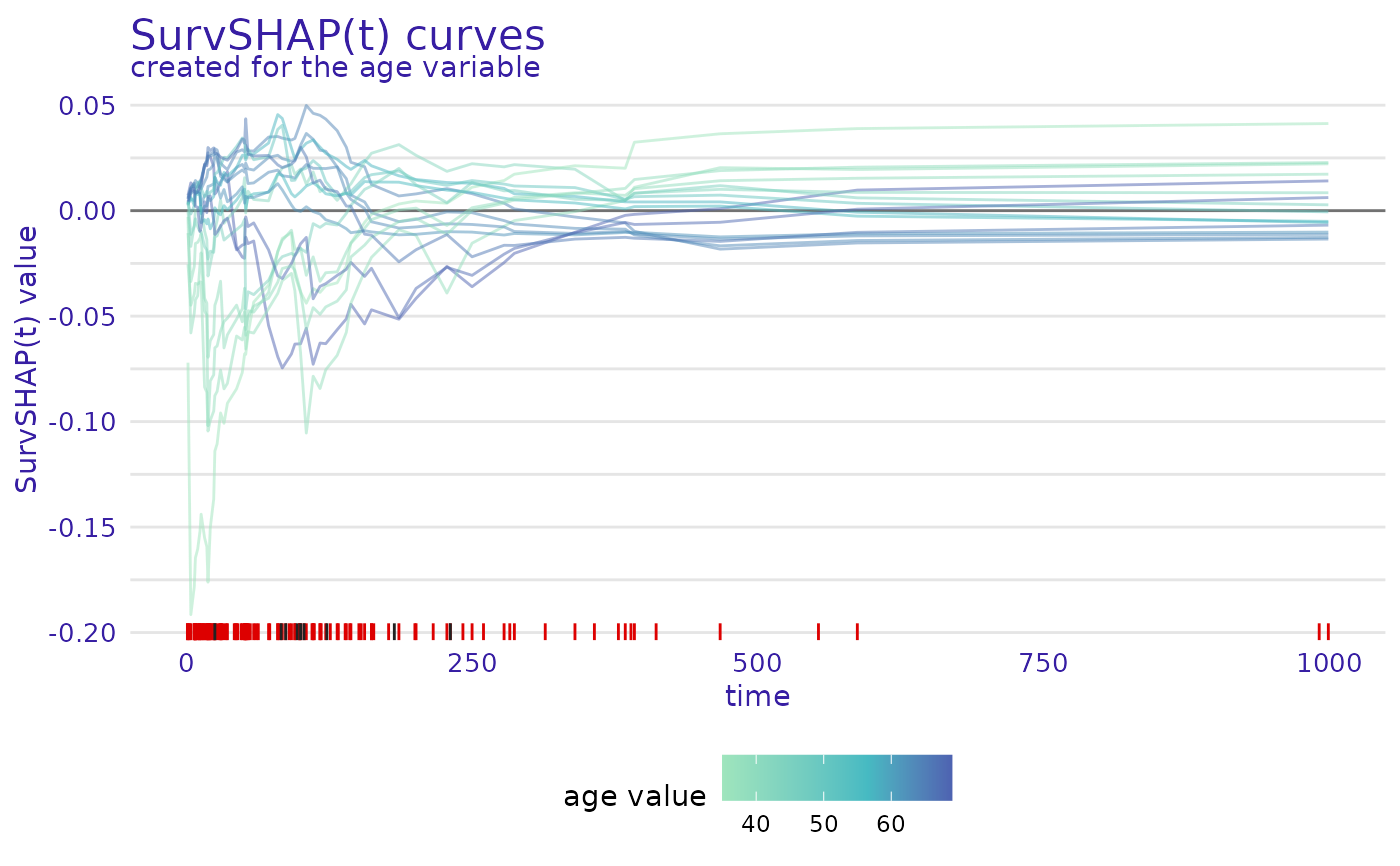
"importance","beeswarm","profile"or"curves". Type of chart to be plotted;"importance"shows the importance of variables over time and aggregated,"beeswarm"shows the distribution of SurvSHAP(t) values for variables and observations,"profile"shows the dependence of SurvSHAP(t) values on variable values,"curves"shows all SurvSHAP(t) curves for selected variable colored by its value or with functional boxplot ifboxplot = TRUE.- ...
additional parameters passed to internal functions
- title
character, title of the plot
- subtitle
character, subtitle of the plot,
'default'automatically generates "created for the XXX model (n = YYY)", where XXX is the explainer label and YYY is the number of observations used for calculations- max_vars
maximum number of variables to be plotted (least important variables are ignored), by default 7
- colors
character vector containing the colors to be used for plotting variables (containing either hex codes "#FF69B4", or names "blue"). If
geom = "importance", the first color will be used for the barplot, the rest for the lines.
Value
An object of the class ggplot.
Plot options
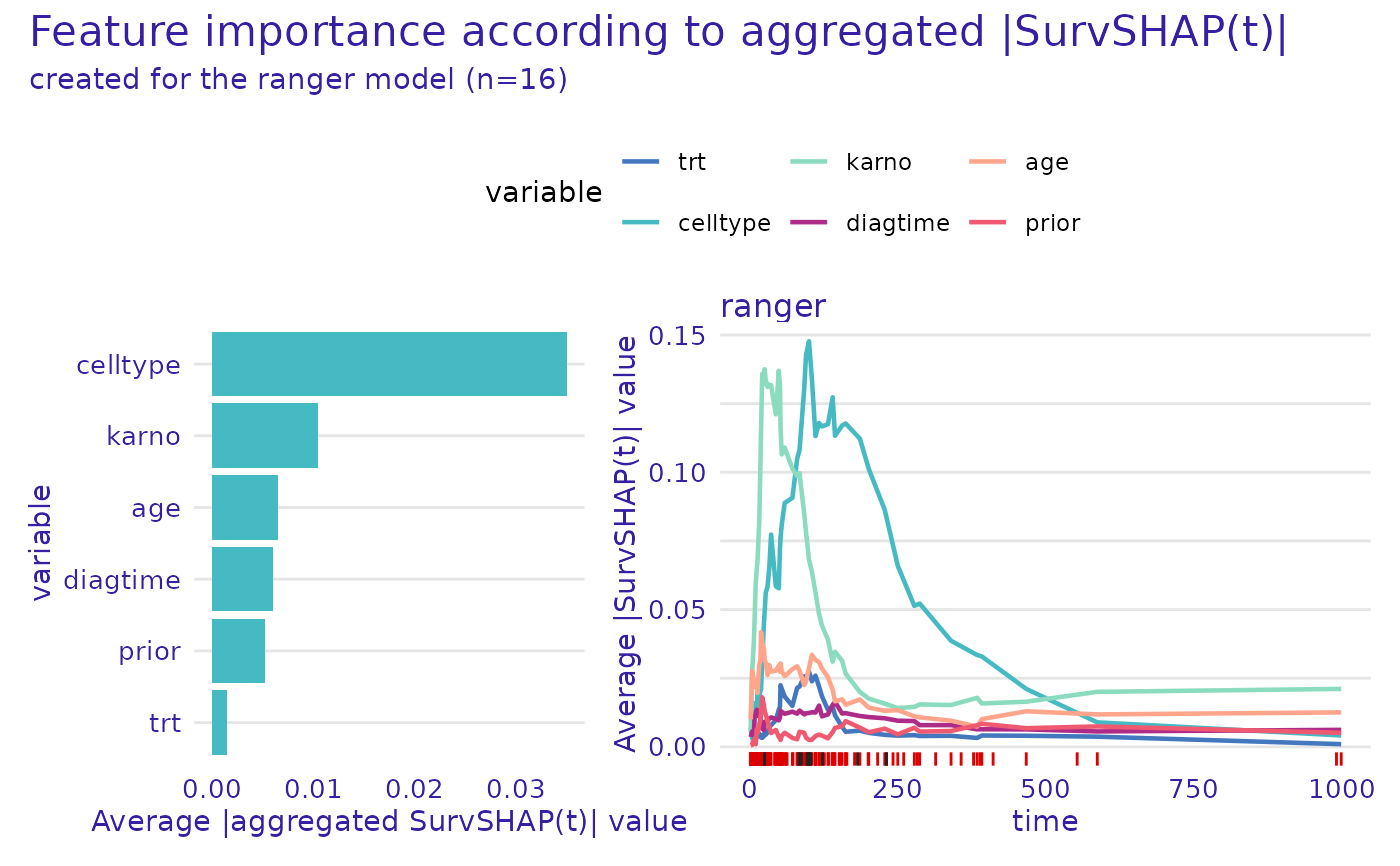
plot.aggregated_surv_shap(geom = "importance")
rug- character, one of"all","events","censors","none"orNULL. Which times to mark on the x axis ingeom_rug().rug_colors- character vector containing two colors (containing either hex codes "#FF69B4", or names "blue"). The first color (red by default) will be used to mark event times, whereas the second (grey by default) will be used to mark censor times.xlab_left, ylab_right- axis labels for left and right plots (due to different aggregation possibilities)
plot.aggregated_surv_shap(geom = "profile")
variable- variable for which the profile is to be plotted, by default first from result datacolor_variable- variable used to denote the color, by default equal tovariable
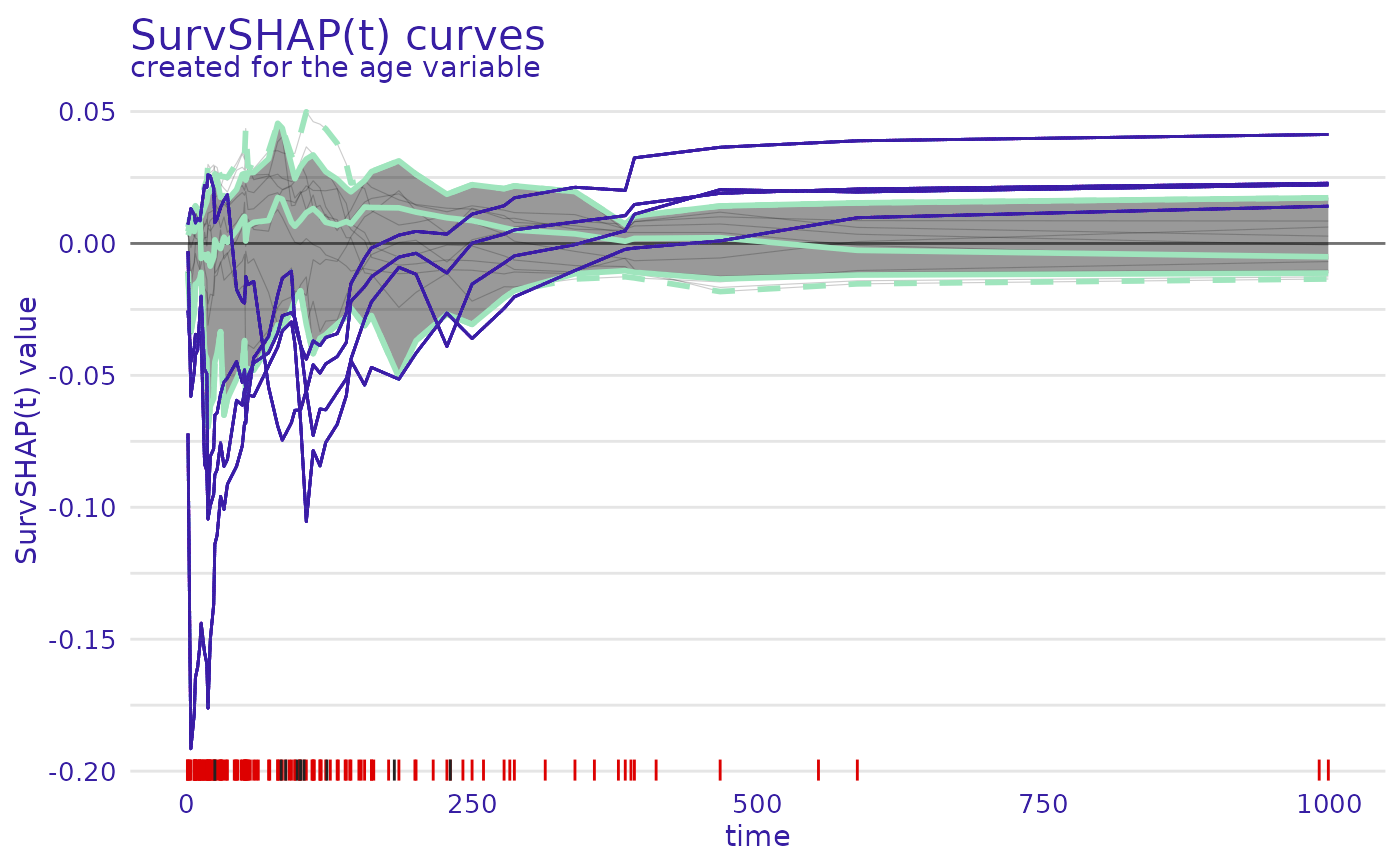
plot.aggregated_surv_shap(geom = "curves")
variable- variable for which SurvSHAP(t) curves are to be plotted, by default first from result databoxplot- whether to plot functional boxplot with marked outliers or all curves colored by variable valuecoef- length of the functional boxplot's whiskers as multiple of IQR, by default 1.5
Examples
# \donttest{
veteran <- survival::veteran
rsf_ranger <- ranger::ranger(
survival::Surv(time, status) ~ .,
data = veteran,
respect.unordered.factors = TRUE,
num.trees = 100,
mtry = 3,
max.depth = 5
)
rsf_ranger_exp <- explain(
rsf_ranger,
data = veteran[, -c(3, 4)],
y = survival::Surv(veteran$time, veteran$status),
verbose = FALSE
)
ranger_global_survshap <- model_survshap(
explainer = rsf_ranger_exp,
new_observation = veteran[
c(1:4, 17:20, 110:113, 126:129),
!colnames(veteran) %in% c("time", "status")
],
y_true = survival::Surv(
veteran$time[c(1:4, 17:20, 110:113, 126:129)],
veteran$status[c(1:4, 17:20, 110:113, 126:129)]
),
aggregation_method = "integral",
calculation_method = "kernelshap",
)
plot(ranger_global_survshap)
 plot(ranger_global_survshap, geom = "beeswarm")
 plot(ranger_global_survshap, geom = "profile",
variable = "age", color_variable = "karno")
plot(ranger_global_survshap, geom = "profile",
variable = "age", color_variable = "karno")
 plot(ranger_global_survshap, geom = "curves",
variable = "age")
plot(ranger_global_survshap, geom = "curves",
variable = "age")
 plot(ranger_global_survshap, geom = "curves",
variable = "age", boxplot = TRUE)
#> Observations with outlying SurvSHAP(t) values:
#> trt celltype karno diagtime age prior
#> 1 1 squamous 60 7 69 0
#> 3 1 squamous 60 3 38 0
#> 18 1 smallcell 40 2 35 0
#> 128 2 large 30 4 39 10
plot(ranger_global_survshap, geom = "curves",
variable = "age", boxplot = TRUE)
#> Observations with outlying SurvSHAP(t) values:
#> trt celltype karno diagtime age prior
#> 1 1 squamous 60 7 69 0
#> 3 1 squamous 60 3 38 0
#> 18 1 smallcell 40 2 35 0
#> 128 2 large 30 4 39 10
 # }
# }