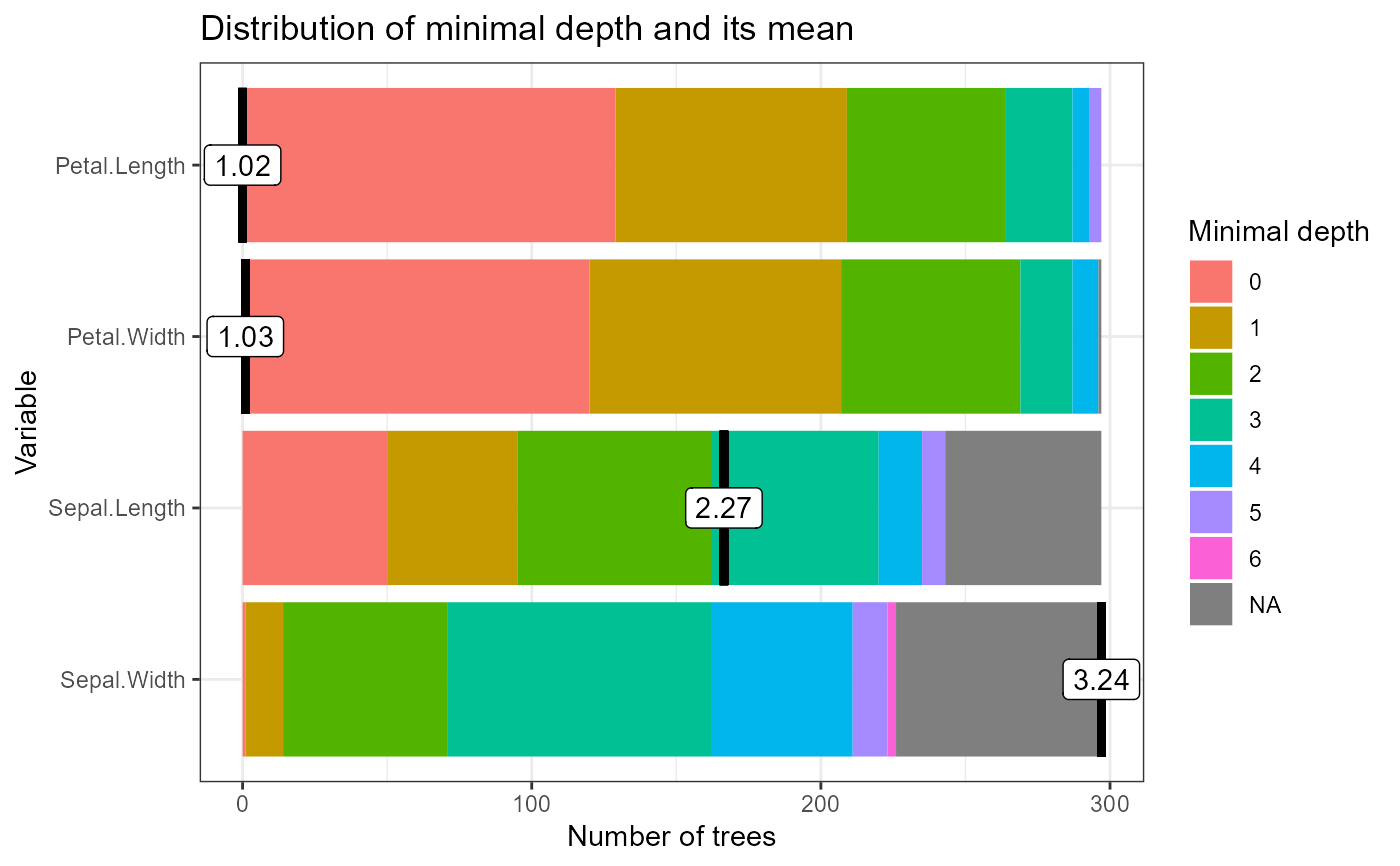
Plot the distribution of minimal depth in a random forest
Source:R/min_depth_distribution.R
plot_min_depth_distribution.RdPlot the distribution of minimal depth in a random forest
plot_min_depth_distribution(
  min_depth_frame,
  k = 10,
  min_no_of_trees = 0,
  mean_sample = "top_trees",
  mean_scale = FALSE,
  mean_round = 2,
  main = "Distribution of minimal depth and its mean"
)
Arguments
- min_depth_frame
A data frame output of min_depth_distribution function or a randomForest object
- k
The maximal number of variables with lowest mean minimal depth to be used for plotting
- min_no_of_trees
The minimal number of trees in which a variable has to be used for splitting to be used for plotting
- mean_sample
The sample of trees on which mean minimal depth is calculated, possible values are "all_trees", "top_trees", "relevant_trees"
- mean_scale
Logical: should the values of mean minimal depth be rescaled to the interval [0,1]?
- mean_round
The number of digits used for displaying mean minimal depth
- main
A string to be used as title of the plot
Value
A ggplot object
Examples
forest <- randomForest::randomForest(Species ~ ., data = iris, ntree = 300)
plot_min_depth_distribution(min_depth_distribution(forest))
