Prints Individual Variable Profiles
Prints Individual Variable Profiles
# S3 method for individual_variable_profile_oscillations
print(x, ...)
Arguments
| x | an individual variable profile explainer produced with the `individual_variable_profile` function |
|---|---|
| ... | other arguments that will be passed to `head()` |
Examples
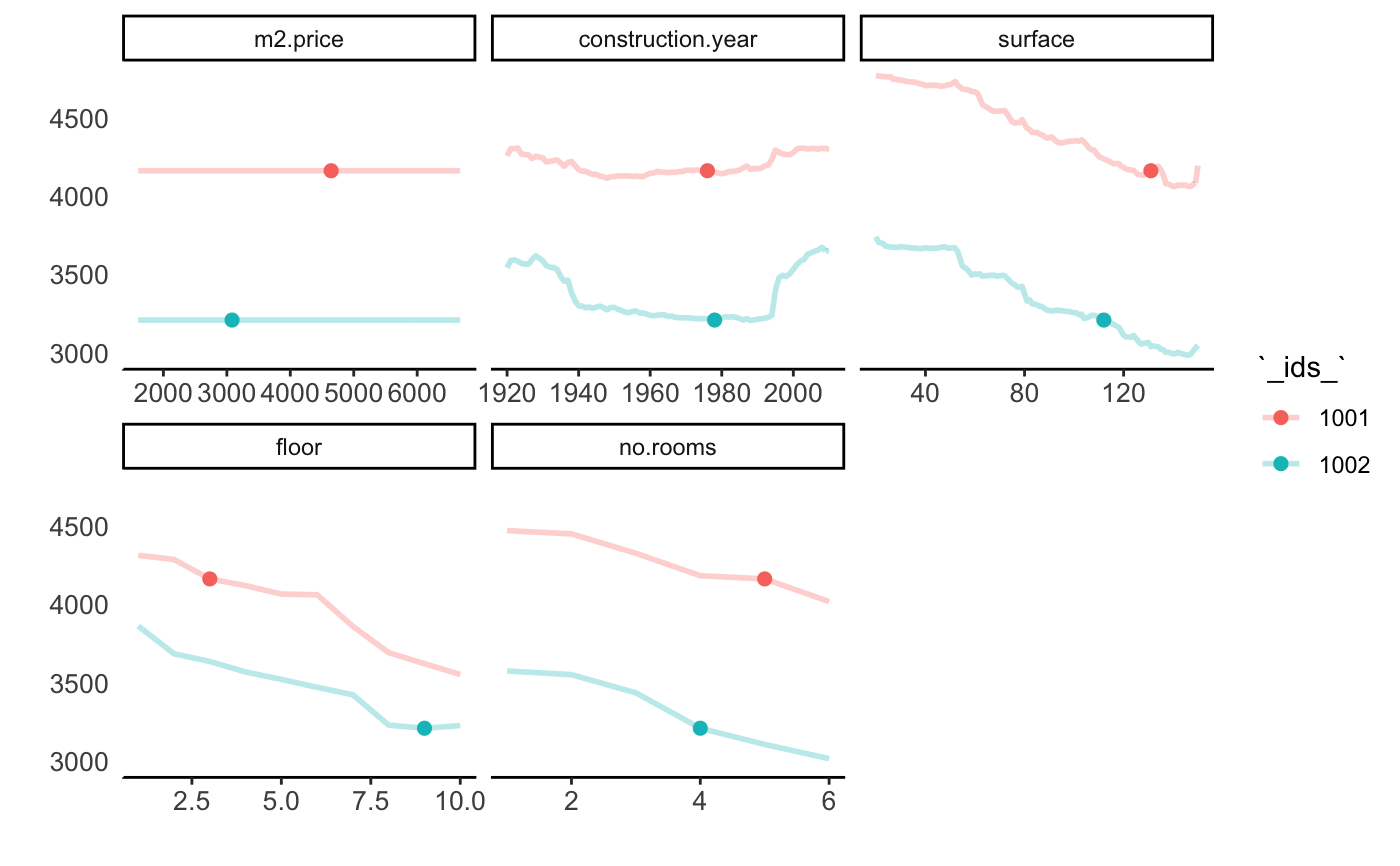
library("DALEX2")library("randomForest") set.seed(59) apartments_rf_model <- randomForest(m2.price ~ construction.year + surface + floor + no.rooms + district, data = apartments) explainer_rf <- explain(apartments_rf_model, data = apartments_test, y = apartments_test$m2.price) apartment <- apartments_test[1:2,] cp_rf <- individual_variable_profile(explainer_rf, apartment) plot(cp_rf, color = "_ids_")#> _vname_ _ids_ oscillations #> 11 district 1001 1103.4248 #> 12 district 1002 506.1531 #> 5 surface 1001 290.5776 #> 8 floor 1002 277.2881 #> 7 floor 1001 243.0352 #> 6 surface 1002 234.4464
