Calculates Individual Variable Profiles aka Ceteris Paribus Profiles
This explainer works for individual observations. For each observation it calculates Individual Variable Profiles for selected variables. For this reason it is also called 'Local Profile Plot'.
individual_variable_profile(x, ...)

# S3 method for explainer
individual_variable_profile(x, new_observation,
  y = NULL, variables = NULL, variable_splits = NULL,
  grid_points = 101, ...)

# S3 method for default
individual_variable_profile(x, data,
  predict_function = predict, new_observation, y = NULL,
  variables = NULL, variable_splits = NULL, grid_points = 101,
  label = class(x)[1], ...)
Arguments
| x | a model to be explained, or an explainer created with function `DALEX::explain()`. |
|---|---|
| ... | other parameters |
| new_observation | a new observation with columns that corresponds to variables used in the model |
| y | true labels for `new_observation`. If specified then will be added to ceteris paribus plots. |
| variables | names of variables for which profiles shall be calculated. Will be passed to `calculate_variable_splits()`. If NULL then all variables from the validation data will be used. |
| variable_splits | named list of splits for variables, in most cases created with `calculate_variable_splits()`. If NULL then it will be calculated based on validation data avaliable in the `explainer`. |
| grid_points | number of points for profile. Will be passed to `calculate_variable_splits()`. |
| data | validation dataset, will be extracted from `x` if it's an explainer |
| predict_function | predict function, will be extracted from `x` if it's an explainer |
| label | name of the model. By default it's extracted from the 'class' attribute of the model |
Value
An object of the class 'ceteris_paribus_explainer'. It's a data frame with calculated average responses.
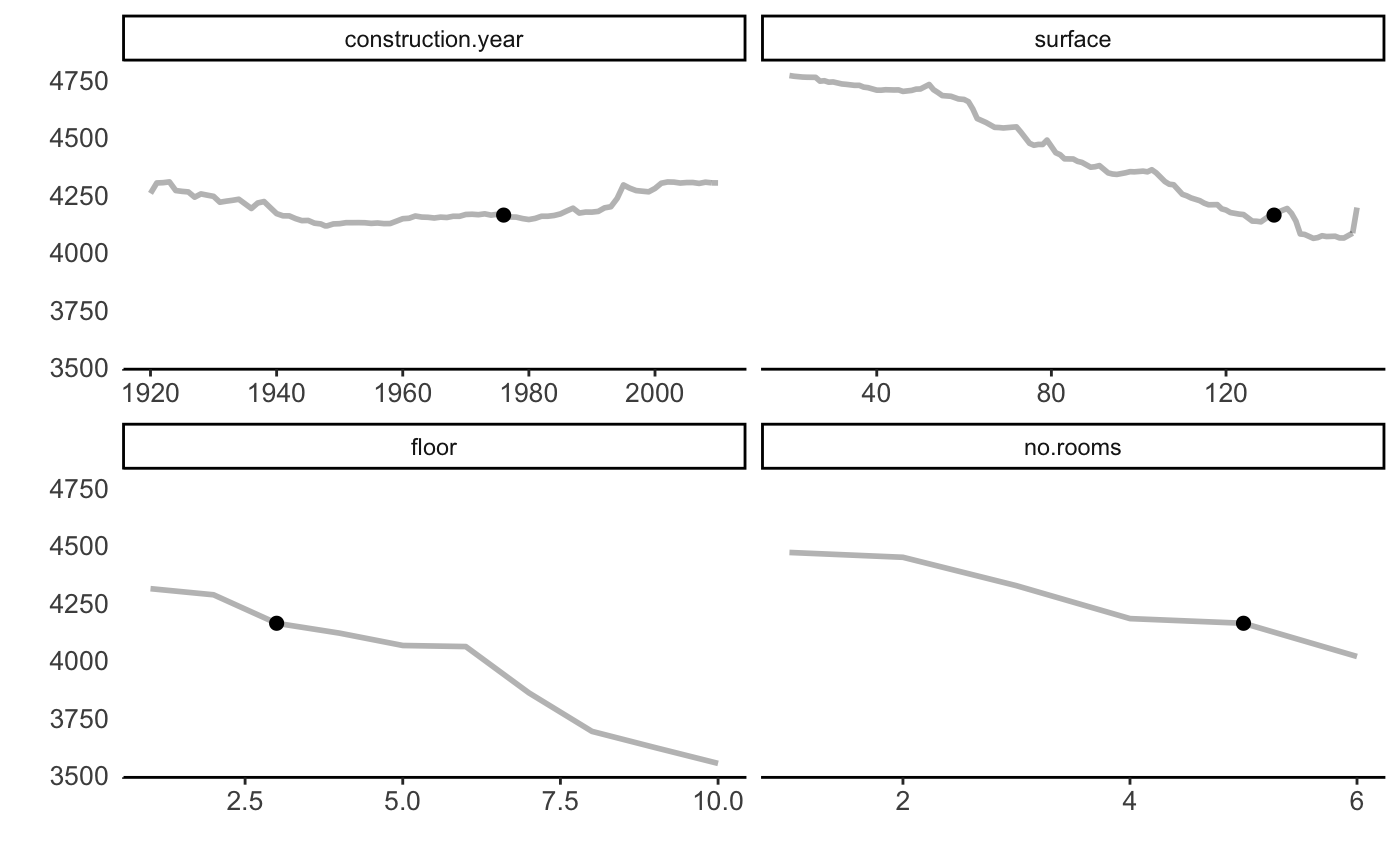
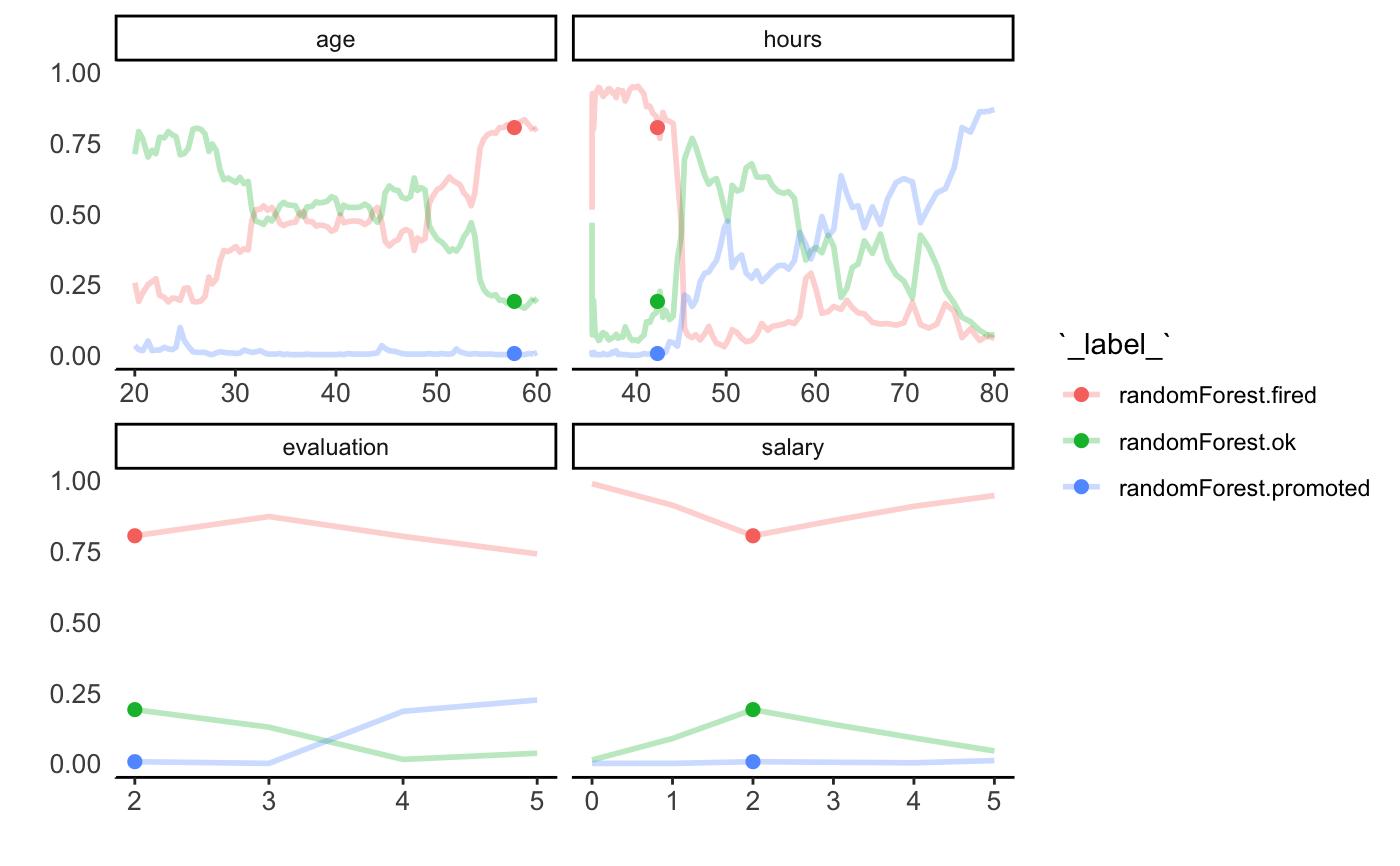
Examples
library("DALEX2") library("ceterisParibus2")library("randomForest") set.seed(59) apartments_rf <- randomForest(m2.price ~ construction.year + surface + floor + no.rooms + district, data = apartments) explainer_rf <- explain(apartments_rf, data = apartments_test[,2:6], y = apartments_test$m2.price) my_apartment <- apartments_test[1, ] lp_rf <- individual_variable_profile(explainer_rf, my_apartment) lp_rf#> Top profiles : #> construction.year surface floor no.rooms district _yhat_ #> 1001 1920 131 3 5 Srodmiescie 4255.354 #> 1001.1 1921 131 3 5 Srodmiescie 4300.702 #> 1001.2 1922 131 3 5 Srodmiescie 4301.926 #> 1001.3 1923 131 3 5 Srodmiescie 4305.352 #> 1001.4 1923 131 3 5 Srodmiescie 4305.352 #> 1001.5 1924 131 3 5 Srodmiescie 4267.723 #> _vname_ _ids_ _label_ #> 1001 construction.year 1001 randomForest #> 1001.1 construction.year 1001 randomForest #> 1001.2 construction.year 1001 randomForest #> 1001.3 construction.year 1001 randomForest #> 1001.4 construction.year 1001 randomForest #> 1001.5 construction.year 1001 randomForest #> #> #> Top observations: #> construction.year surface floor no.rooms district _yhat_ _label_ #> 1001 1976 131 3 5 Srodmiescie 4160.84 randomForest #> _ids_ #> 1001 1plot(lp_rf)# -------- # multiclass HR_rf <- randomForest(status ~ . , data = HR) explainer_rf <- explain(HR_rf, data = HRTest, y = HRTest) my_HR <- HRTest[1, ] lp_rf <- individual_variable_profile(explainer_rf, my_HR) lp_rf#> Top profiles : #> gender age hours evaluation salary status _vname_ _ids_ _yhat_ #> 1 male 57.72683 42.31527 2 2 fired gender 1 0.804 #> 1.1 female 57.72683 42.31527 2 2 fired gender 1 0.226 #> 11 male 20.00212 42.31527 2 2 fired age 1 0.256 #> 1.110 male 20.39166 42.31527 2 2 fired age 1 0.190 #> 1.2 male 20.78820 42.31527 2 2 fired age 1 0.220 #> 1.3 male 21.32338 42.31527 2 2 fired age 1 0.250 #> _label_ #> 1 randomForest.fired #> 1.1 randomForest.fired #> 11 randomForest.fired #> 1.110 randomForest.fired #> 1.2 randomForest.fired #> 1.3 randomForest.fired #> #> #> Top observations: #> gender age hours evaluation salary status _yhat_ #> 1 male 57.72683 42.31527 2 2 fired 0.804 #> 1.1 male 57.72683 42.31527 2 2 fired 0.190 #> 1.2 male 57.72683 42.31527 2 2 fired 0.006 #> _label_ _ids_ #> 1 randomForest.fired 1 #> 1.1 randomForest.ok 1 #> 1.2 randomForest.promoted 1plot(lp_rf, color = "_label_")