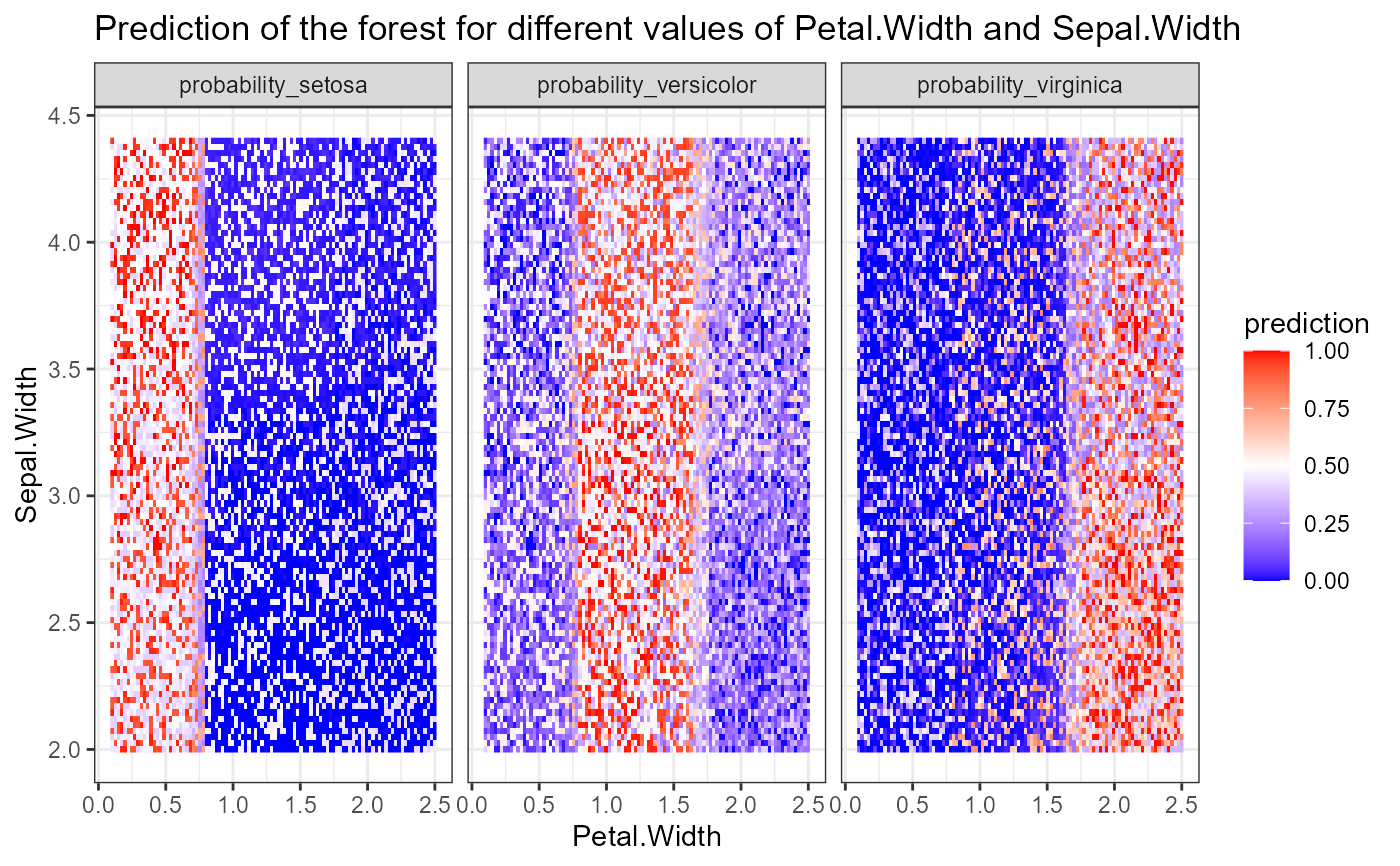
Plot the prediction of the forest for a grid of values of two numerical variables
Source:R/min_depth_interactions.R
plot_predict_interaction.RdPlot the prediction of the forest for a grid of values of two numerical variables
Arguments
- forest
A randomForest or ranger object
- data
The data frame on which forest was trained
- variable1
A character string with the name a numerical predictor that will on X-axis
- variable2
A character string with the name a numerical predictor that will on Y-axis
- grid
The number of points on the one-dimensional grid on x and y-axis
- main
A string to be used as title of the plot
- time
A numeric value specifying the time at which to predict survival probability, only applies to survival forests. If not specified, the time closest to predicted median survival time is used
Value
A ggplot2 object
Examples
forest <- randomForest::randomForest(Species ~., data = iris)
plot_predict_interaction(forest, iris, "Petal.Width", "Sepal.Width")
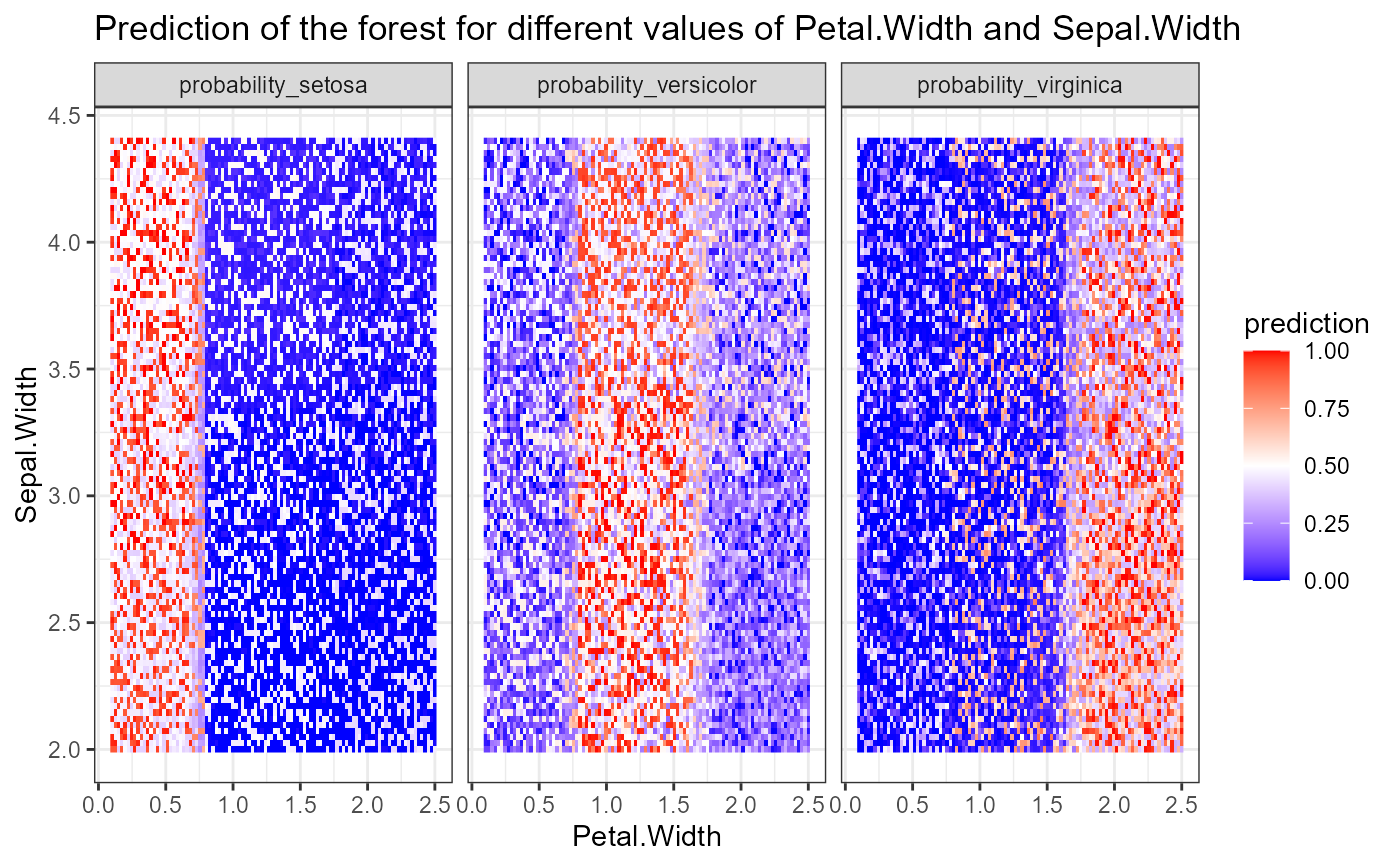 forest_ranger <- ranger::ranger(Species ~., data = iris)
plot_predict_interaction(forest, iris, "Petal.Width", "Sepal.Width")
forest_ranger <- ranger::ranger(Species ~., data = iris)
plot_predict_interaction(forest, iris, "Petal.Width", "Sepal.Width")