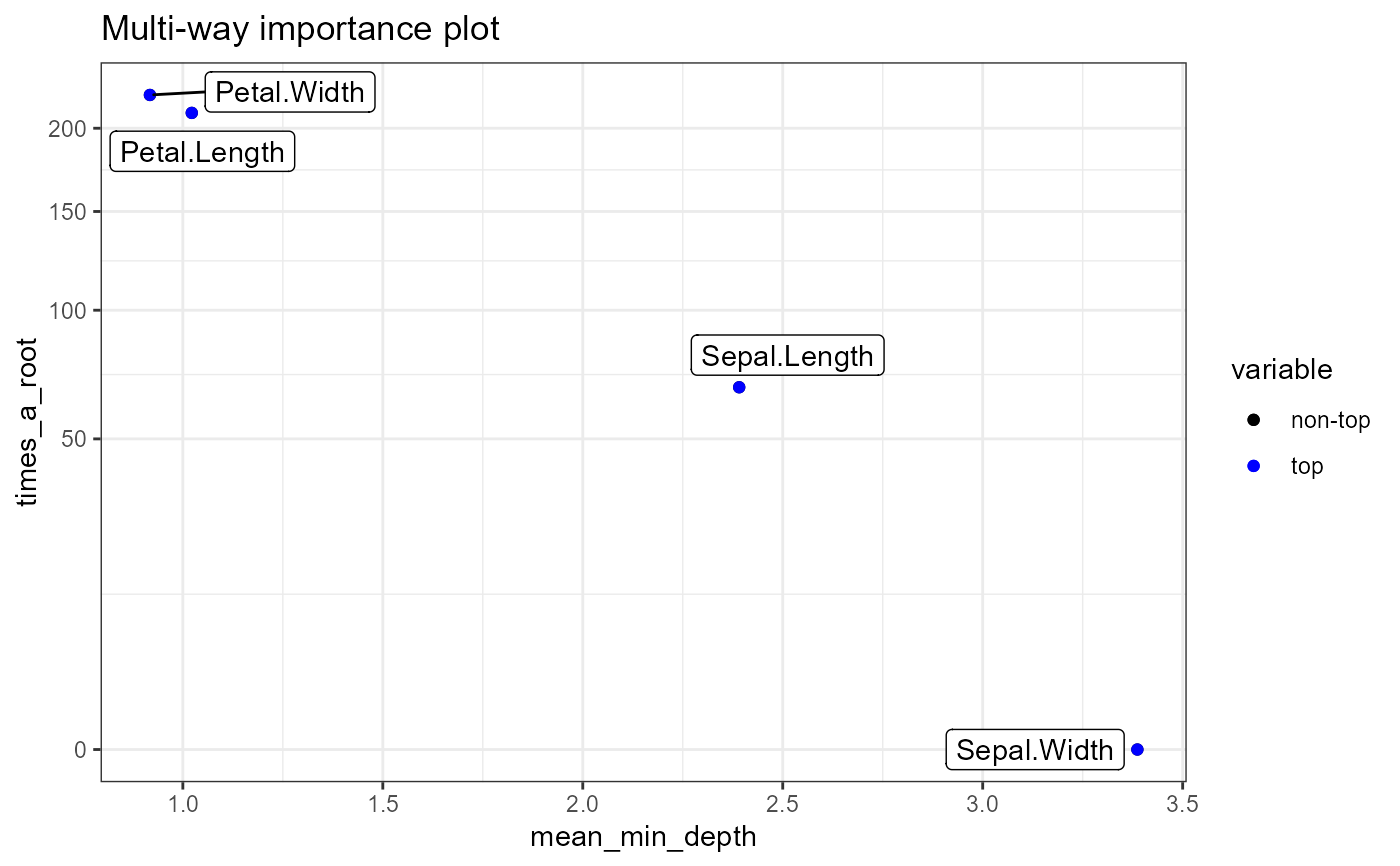
Plot two or three measures of importance of variables in a random fores. Choose importance measures from the colnames(importance_frame).
plot_multi_way_importance(
  importance_frame,
  x_measure = "mean_min_depth",
  y_measure = "times_a_root",
  size_measure = NULL,
  min_no_of_trees = 0,
  no_of_labels = 10,
  main = "Multi-way importance plot"
)
Arguments
- importance_frame
A result of using the function measure_importance() to a random forest or a randomForest object
- x_measure
The measure of importance to be shown on the X axis
- y_measure
The measure of importance to be shown on the Y axis
- size_measure
The measure of importance to be shown as size of points (optional)
- min_no_of_trees
The minimal number of trees in which a variable has to be used for splitting to be used for plotting
- no_of_labels
The approximate number of best variables (according to all measures plotted) to be labeled (more will be labeled in case of ties)
- main
A string to be used as title of the plot
Value
A ggplot object
Examples
forest <- randomForest::randomForest(Species ~ ., data = iris, localImp = TRUE)
plot_multi_way_importance(measure_importance(forest))