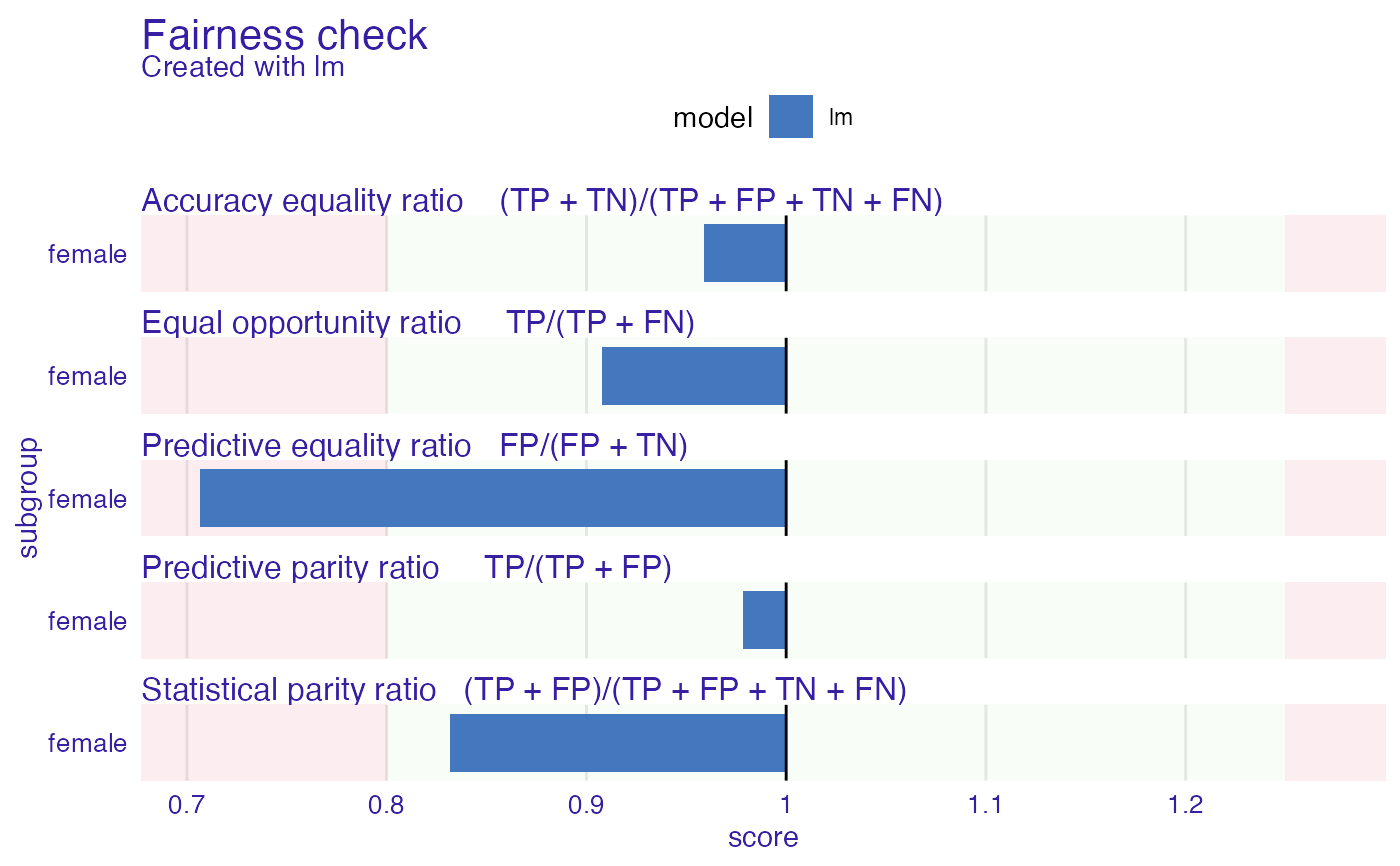
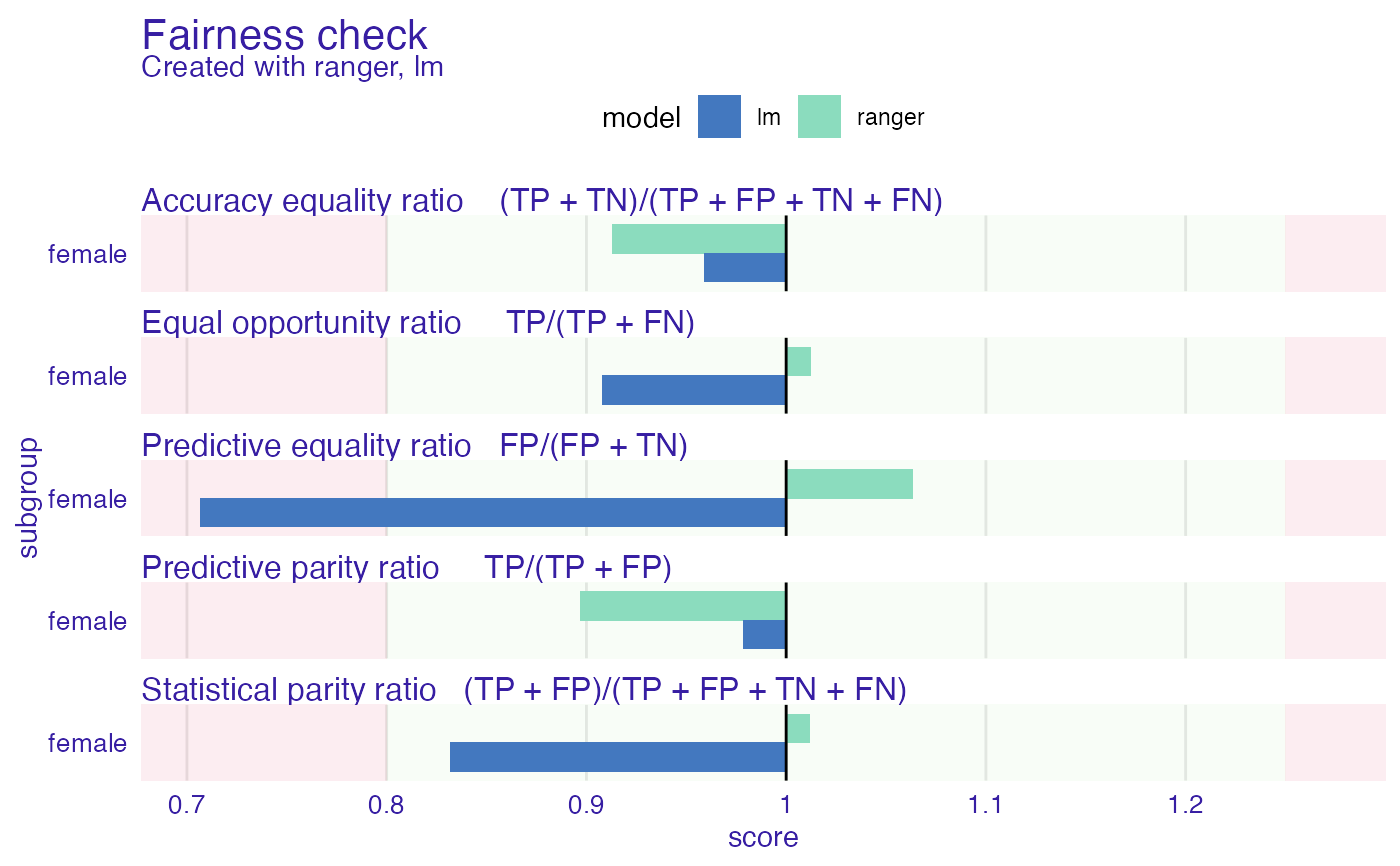
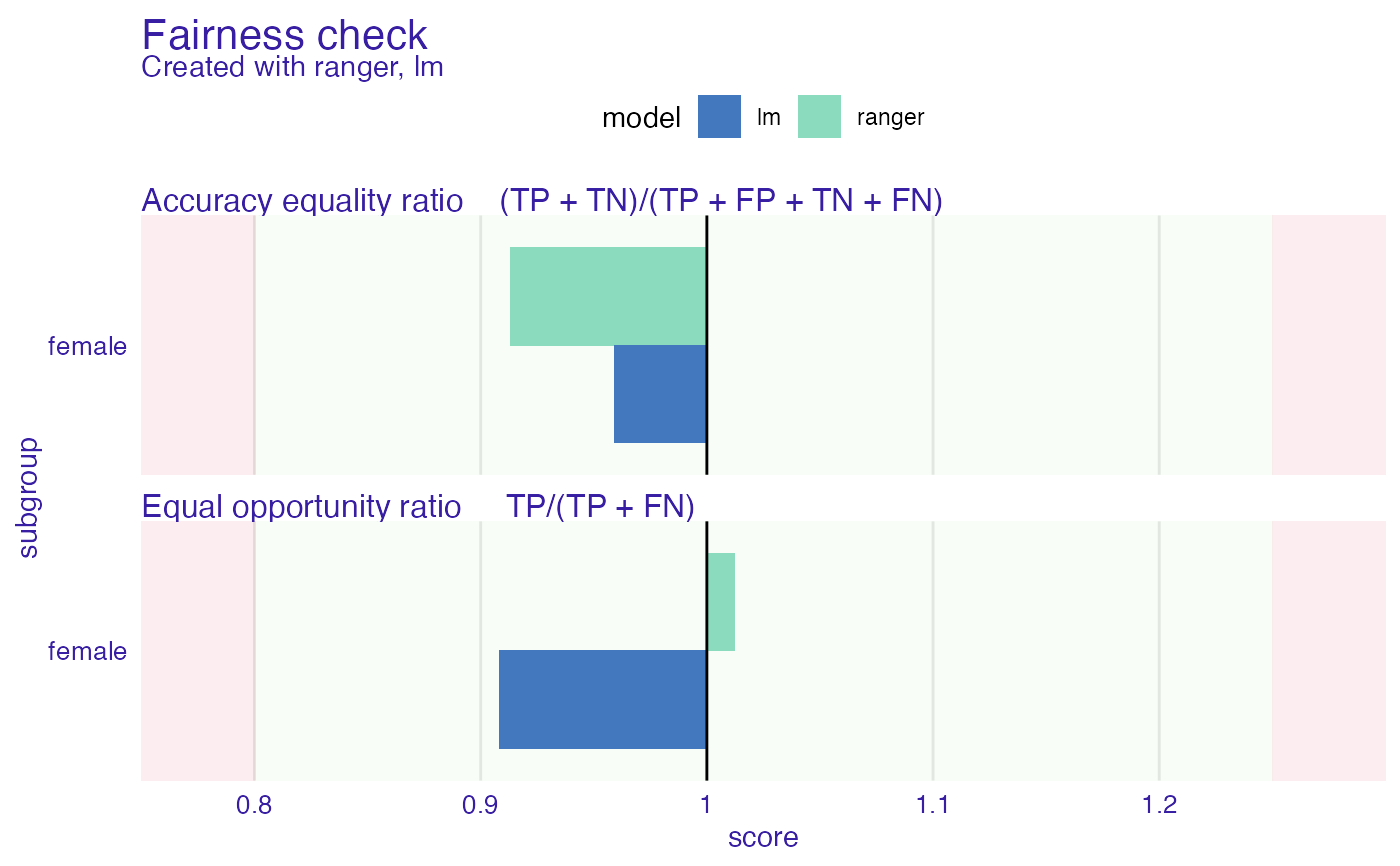
Plot fairness check enables to look how big differences are between base subgroup (privileged) and unprivileged ones.
If bar plot reaches red zone it means that for this subgroup fairness goal is not satisfied. Multiple subgroups and models can be plotted.
Red and green zone boundary can be moved through epsilon parameter, that needs to be passed through fairness_check.
# S3 method for fairness_object
plot(x, ..., fairness_metrics = c("ACC", "TPR", "PPV", "FPR", "STP"))
Arguments
| x |
|
|---|---|
| ... | other plot parameters |
| fairness_metrics | character, vector of metrics. Subset of fairness metrics to be used. The full set is defined as c("ACC", "TPR", "PPV", "FPR", "STP"). |
Value
ggplot2 object
Examples
data("german")

y_numeric <- as.numeric(german$Risk) - 1

lm_model <- glm(Risk ~ .,
  data = german,
  family = binomial(link = "logit")
)

explainer_lm <- DALEX::explain(lm_model, data = german[, -1], y = y_numeric)
#> Preparation of a new explainer is initiated
#>   -> model label       :  lm  (  default  )
#>   -> data              :  1000  rows  9  cols
#>   -> target variable   :  1000  values
#>   -> predict function  :  yhat.glm  will be used (  default  )
#>   -> predicted values  :  No value for predict function target column. (  default  )
#>   -> model_info        :  package stats , ver. 4.1.1 , task classification (  default  )
#>   -> predicted values  :  numerical, min =  0.1369187 , mean =  0.7 , max =  0.9832426
#>   -> residual function :  difference between y and yhat (  default  )
#>   -> residuals         :  numerical, min =  -0.9572803 , mean =  1.940006e-17 , max =  0.8283475
#>   A new explainer has been created!

fobject <- fairness_check(explainer_lm,
  protected = german$Sex,
  privileged = "male"
)
#> Creating fairness classification object
#> -> Privileged subgroup		: character ( Ok  )
#> -> Protected variable		: factor ( Ok  )
#> -> Cutoff values for explainers	: 0.5 ( for all subgroups )
#> -> Fairness objects		: 0 objects
#> -> Checking explainers		: 1 in total (  compatible  )
#> -> Metric calculation		: 13/13 metrics calculated for all models
#>  Fairness object created succesfully
plot(fobject)

# \donttest{
rf_model <- ranger::ranger(Risk ~ .,
  data = german,
  probability = TRUE,
  max.depth = 3,
  num.trees = 100,
  seed = 1
)


explainer_rf <- DALEX::explain(rf_model,
  data = german[, -1],
  y = y_numeric
)
#> Preparation of a new explainer is initiated
#>   -> model label       :  ranger  (  default  )
#>   -> data              :  1000  rows  9  cols
#>   -> target variable   :  1000  values
#>   -> predict function  :  yhat.ranger  will be used (  default  )
#>   -> predicted values  :  No value for predict function target column. (  default  )
#>   -> model_info        :  package ranger , ver. 0.13.1 , task classification (  default  )
#>   -> predicted values  :  numerical, min =  0.2744313 , mean =  0.6991764 , max =  0.9021086
#>   -> residual function :  difference between y and yhat (  default  )
#>   -> residuals         :  numerical, min =  -0.8758052 , mean =  0.0008235875 , max =  0.6119131
#>   A new explainer has been created!

fobject <- fairness_check(explainer_rf, fobject)
#> Creating fairness classification object
#> -> Privileged subgroup		: character ( from first fairness object  )
#> -> Protected variable		: factor ( from first fairness object  )
#> -> Cutoff values for explainers	: 0.5 ( for all subgroups )
#> -> Fairness objects		: 1 object (  compatible  )
#> -> Checking explainers		: 2 in total (  compatible  )
#> -> Metric calculation		: 13/13 metrics calculated for all models
#>  Fairness object created succesfully

plot(fobject)


# custom print
plot(fobject, fairness_metrics = c("ACC", "TPR"))

# }
# }