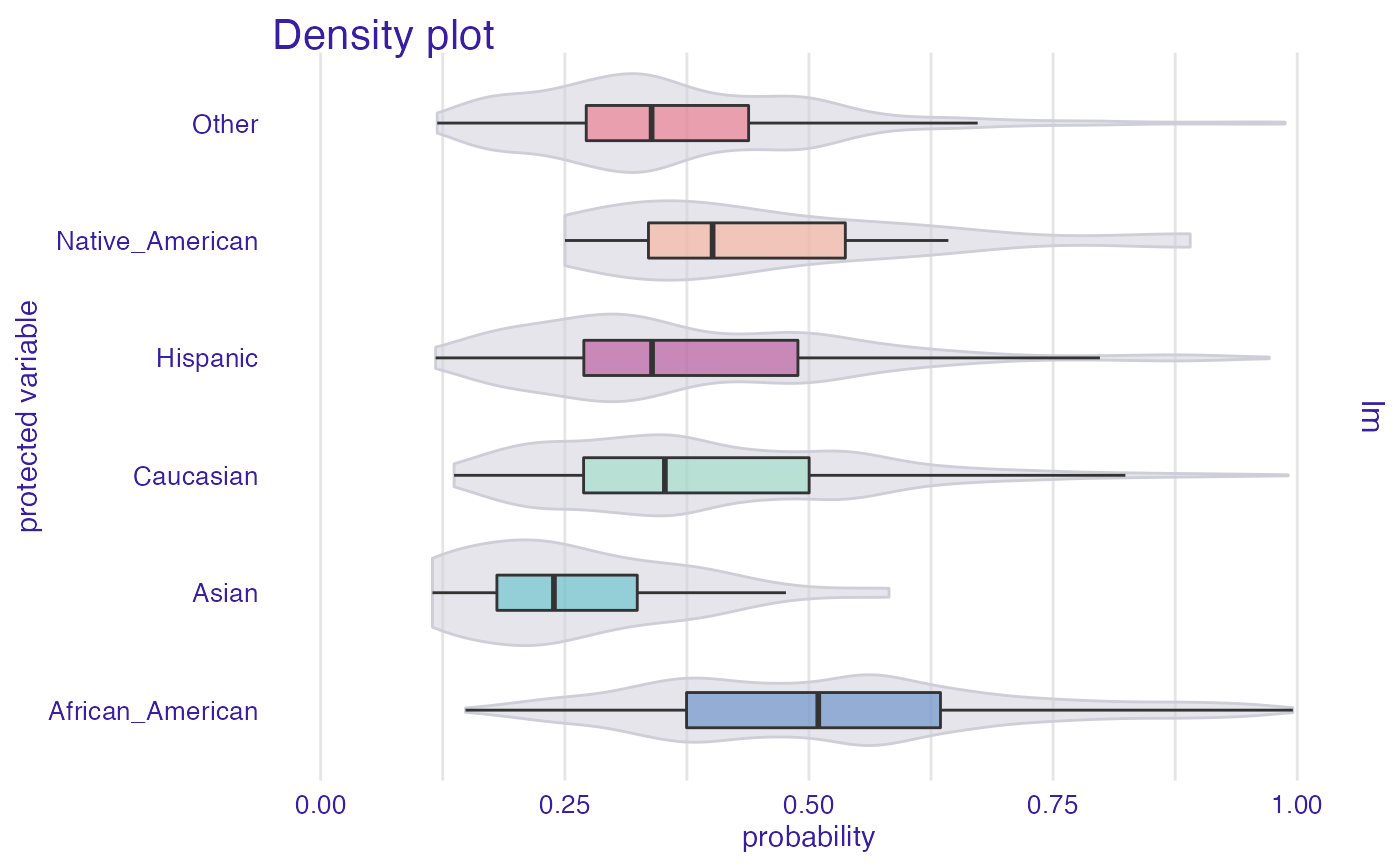
Plot distribution for models output probabilities. See how being in particular subgroup affects models decision.
plot_density(x, ...)Arguments
| x | object of class |
|---|---|
| ... | other plot parameters |
Value
ggplot2 object
Examples
data("compas")

glm_compas <- glm(Two_yr_Recidivism ~ ., data = compas, family = binomial(link = "logit"))

y_numeric <- as.numeric(compas$Two_yr_Recidivism) - 1

explainer_glm <- DALEX::explain(glm_compas, data = compas, y = y_numeric)
#> Preparation of a new explainer is initiated
#>   -> model label       :  lm  (  default  )
#>   -> data              :  6172  rows  7  cols
#>   -> target variable   :  6172  values
#>   -> predict function  :  yhat.glm  will be used (  default  )
#>   -> predicted values  :  No value for predict function target column. (  default  )
#>   -> model_info        :  package stats , ver. 4.1.1 , task classification (  default  )
#>   -> predicted values  :  numerical, min =  0.1144574 , mean =  0.4551199 , max =  0.995477
#>   -> residual function :  difference between y and yhat (  default  )
#>   -> residuals         :  numerical, min =  -0.9767658 , mean =  5.070175e-13 , max =  0.8822826
#>   A new explainer has been created!

fobject <- fairness_check(explainer_glm,
  protected = compas$Ethnicity,
  privileged = "Caucasian"
)
#> Creating fairness classification object
#> -> Privileged subgroup		: character ( Ok  )
#> -> Protected variable		: factor ( Ok  )
#> -> Cutoff values for explainers	: 0.5 ( for all subgroups )
#> -> Fairness objects		: 0 objects
#> -> Checking explainers		: 1 in total (  compatible  )
#> -> Metric calculation		: 8/13 metrics calculated for all models ( 5 NA created )
#>  Fairness object created succesfully

plot_density(fobject)