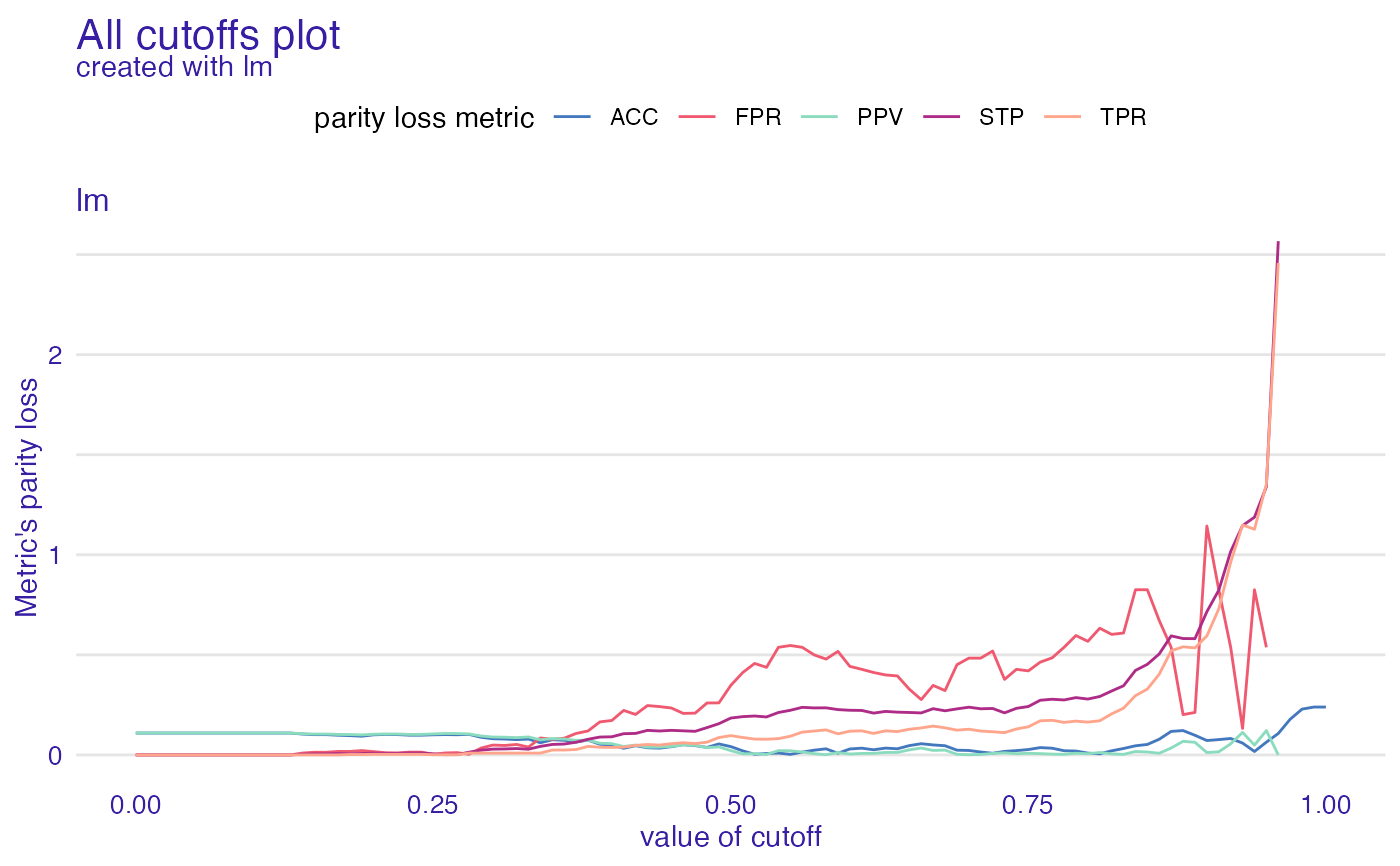
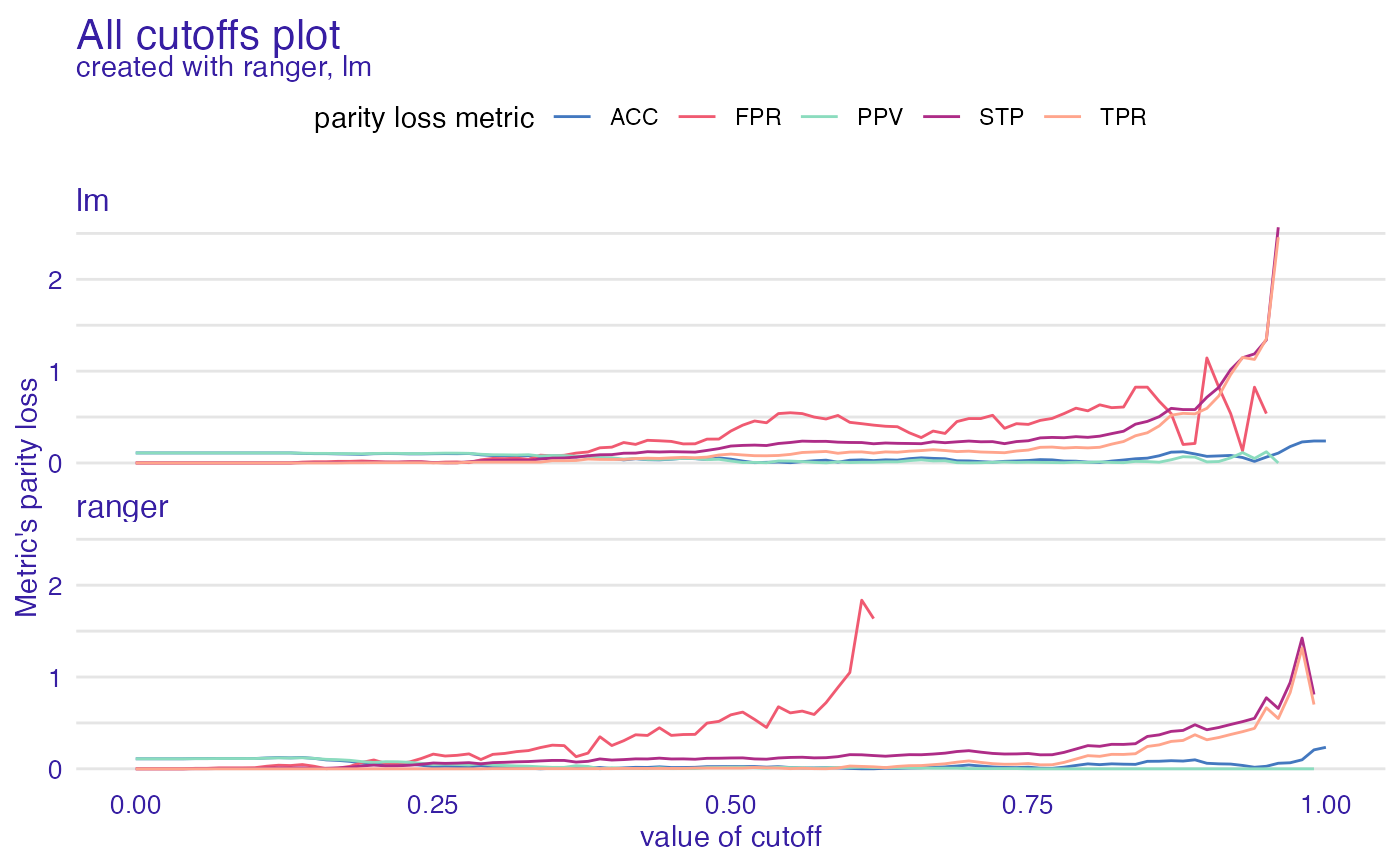
All cutoffs plot allows to check how parity loss of chosen metrics is affected by the change of cutoff. Values of cutoff
are the same for all subgroups (levels of protected variable) no matter what cutoff values were in fairness_object.
# S3 method for all_cutoffs
plot(x, ..., label = NULL)
Arguments
| x |
|
|---|---|
| ... | other plot parameters |
| label | character, label of model to plot. Default NULL. If default prints all models. |
Value
ggplot2 object
Examples
data("german")

y_numeric <- as.numeric(german$Risk) - 1

lm_model <- glm(Risk ~ .,
  data = german,
  family = binomial(link = "logit")
)

explainer_lm <- DALEX::explain(lm_model, data = german[, -1], y = y_numeric)
#> Preparation of a new explainer is initiated
#>   -> model label       :  lm  (  default  )
#>   -> data              :  1000  rows  9  cols
#>   -> target variable   :  1000  values
#>   -> predict function  :  yhat.glm  will be used (  default  )
#>   -> predicted values  :  No value for predict function target column. (  default  )
#>   -> model_info        :  package stats , ver. 4.1.1 , task classification (  default  )
#>   -> predicted values  :  numerical, min =  0.1369187 , mean =  0.7 , max =  0.9832426
#>   -> residual function :  difference between y and yhat (  default  )
#>   -> residuals         :  numerical, min =  -0.9572803 , mean =  1.940006e-17 , max =  0.8283475
#>   A new explainer has been created!

fobject <- fairness_check(explainer_lm,
  protected = german$Sex,
  privileged = "male"
)
#> Creating fairness classification object
#> -> Privileged subgroup		: character ( Ok  )
#> -> Protected variable		: factor ( Ok  )
#> -> Cutoff values for explainers	: 0.5 ( for all subgroups )
#> -> Fairness objects		: 0 objects
#> -> Checking explainers		: 1 in total (  compatible  )
#> -> Metric calculation		: 13/13 metrics calculated for all models
#>  Fairness object created succesfully

ac <- all_cutoffs(fobject)
plot(ac)
#> Warning: Removed 17 row(s) containing missing values (geom_path).

# \donttest{
rf_model <- ranger::ranger(Risk ~ .,
  data = german,
  probability = TRUE,
  num.trees = 100,
  seed = 1
)


explainer_rf <- DALEX::explain(rf_model,
  data = german[, -1],
  y = y_numeric
)
#> Preparation of a new explainer is initiated
#>   -> model label       :  ranger  (  default  )
#>   -> data              :  1000  rows  9  cols
#>   -> target variable   :  1000  values
#>   -> predict function  :  yhat.ranger  will be used (  default  )
#>   -> predicted values  :  No value for predict function target column. (  default  )
#>   -> model_info        :  package ranger , ver. 0.13.1 , task classification (  default  )
#>   -> predicted values  :  numerical, min =  0.04380952 , mean =  0.6969957 , max =  1
#>   -> residual function :  difference between y and yhat (  default  )
#>   -> residuals         :  numerical, min =  -0.7478095 , mean =  0.003004293 , max =  0.708996
#>   A new explainer has been created!

fobject <- fairness_check(explainer_rf, fobject)
#> Creating fairness classification object
#> -> Privileged subgroup		: character ( from first fairness object  )
#> -> Protected variable		: factor ( from first fairness object  )
#> -> Cutoff values for explainers	: 0.5 ( for all subgroups )
#> -> Fairness objects		: 1 object (  compatible  )
#> -> Checking explainers		: 2 in total (  compatible  )
#> -> Metric calculation		: 10/13 metrics calculated for all models ( 3 NA created )
#>  Fairness object created succesfully

ac <- all_cutoffs(fobject)
plot(ac)
#> Warning: Removed 41 row(s) containing missing values (geom_path).

# }
# }