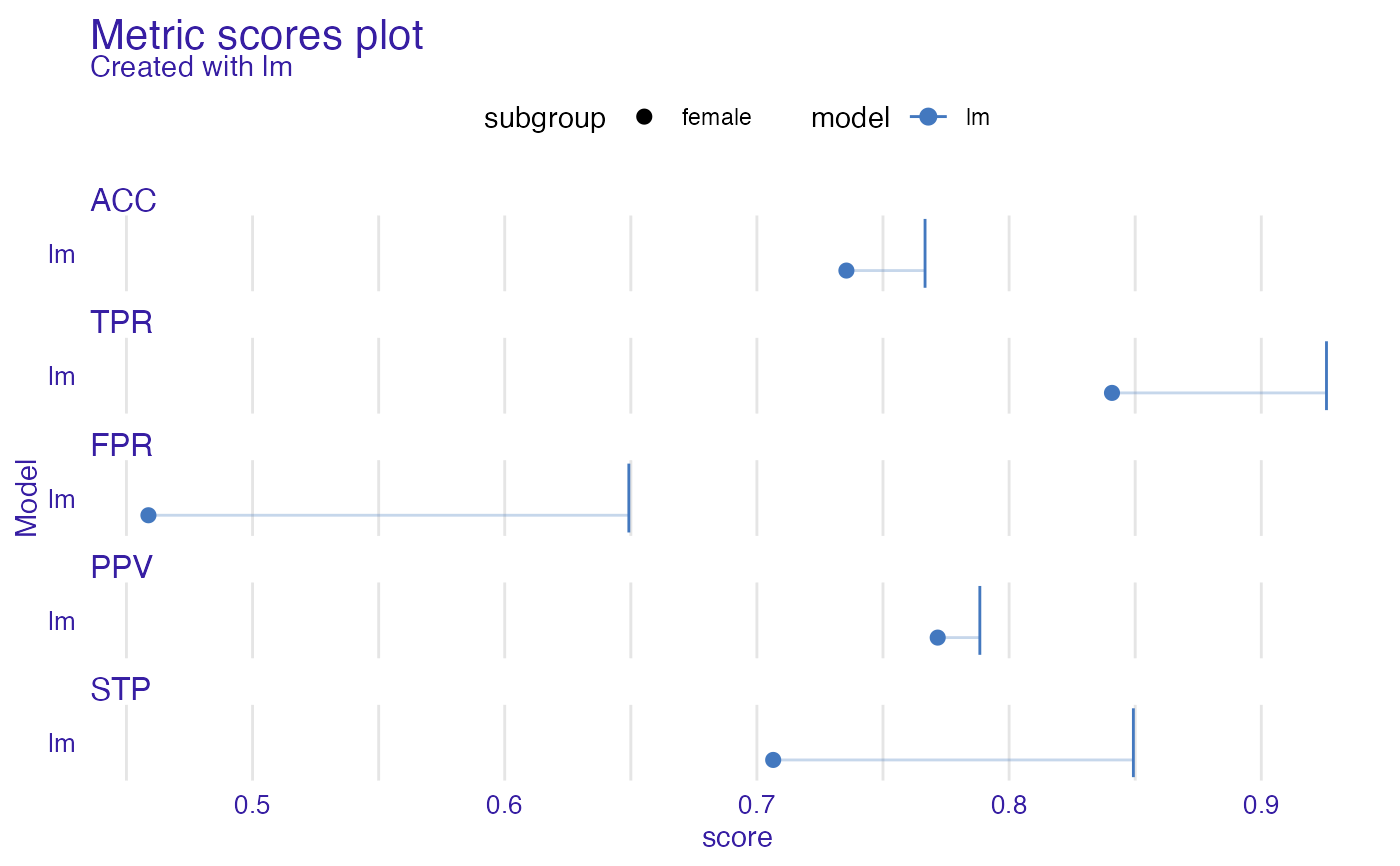
Creates metric_scores object to facilitate visualization. Check how the metric scores differ among models, what is this score, and how it changes
for example after applying bias mitigation technique. The vertical black lines
denote the scores for privileged subgroup. It is best to use only few metrics (using fairness_metrics parameter)
metric_scores(x, fairness_metrics = c("ACC", "TPR", "PPV", "FPR", "STP"))Arguments
| x | object of class |
|---|---|
| fairness_metrics | character, vector with fairness metric names. Default metrics are ones in |
Value
metric_scores object.
It is a list containing:
metric_scores_data -
data.framewith information about score in particular subgroup, metric, and modelprivileged - name of privileged subgroup
Examples
data("german")
y_numeric <- as.numeric(german$Risk) - 1
lm_model <- glm(Risk ~ .,
data = german,
family = binomial(link = "logit")
)
explainer_lm <- DALEX::explain(lm_model, data = german[, -1], y = y_numeric)
#> Preparation of a new explainer is initiated
#> -> model label : lm ( default )
#> -> data : 1000 rows 9 cols
#> -> target variable : 1000 values
#> -> predict function : yhat.glm will be used ( default )
#> -> predicted values : No value for predict function target column. ( default )
#> -> model_info : package stats , ver. 4.1.1 , task classification ( default )
#> -> predicted values : numerical, min = 0.1369187 , mean = 0.7 , max = 0.9832426
#> -> residual function : difference between y and yhat ( default )
#> -> residuals : numerical, min = -0.9572803 , mean = 1.940006e-17 , max = 0.8283475
#> A new explainer has been created!
fobject <- fairness_check(explainer_lm,
protected = german$Sex,
privileged = "male"
)
#> Creating fairness classification object
#> -> Privileged subgroup : character ( Ok )
#> -> Protected variable : factor ( Ok )
#> -> Cutoff values for explainers : 0.5 ( for all subgroups )
#> -> Fairness objects : 0 objects
#> -> Checking explainers : 1 in total ( compatible )
#> -> Metric calculation : 13/13 metrics calculated for all models
#> Fairness object created succesfully
ms <- metric_scores(fobject, fairness_metrics = c("ACC", "TPR", "PPV", "FPR", "STP"))
plot(ms)
 # \donttest{
rf_model <- ranger::ranger(Risk ~ .,
data = german,
probability = TRUE,
num.trees = 200
)
explainer_rf <- DALEX::explain(rf_model, data = german[, -1], y = y_numeric)
#> Preparation of a new explainer is initiated
#> -> model label : ranger ( default )
#> -> data : 1000 rows 9 cols
#> -> target variable : 1000 values
#> -> predict function : yhat.ranger will be used ( default )
#> -> predicted values : No value for predict function target column. ( default )
#> -> model_info : package ranger , ver. 0.13.1 , task classification ( default )
#> -> predicted values : numerical, min = 0.07945635 , mean = 0.6984925 , max = 0.9967857
#> -> residual function : difference between y and yhat ( default )
#> -> residuals : numerical, min = -0.7482123 , mean = 0.001507462 , max = 0.6149175
#> A new explainer has been created!
fobject <- fairness_check(explainer_rf, fobject)
#> Creating fairness classification object
#> -> Privileged subgroup : character ( from first fairness object )
#> -> Protected variable : factor ( from first fairness object )
#> -> Cutoff values for explainers : 0.5 ( for all subgroups )
#> -> Fairness objects : 1 object ( compatible )
#> -> Checking explainers : 2 in total ( compatible )
#> -> Metric calculation : 13/13 metrics calculated for all models
#> Fairness object created succesfully
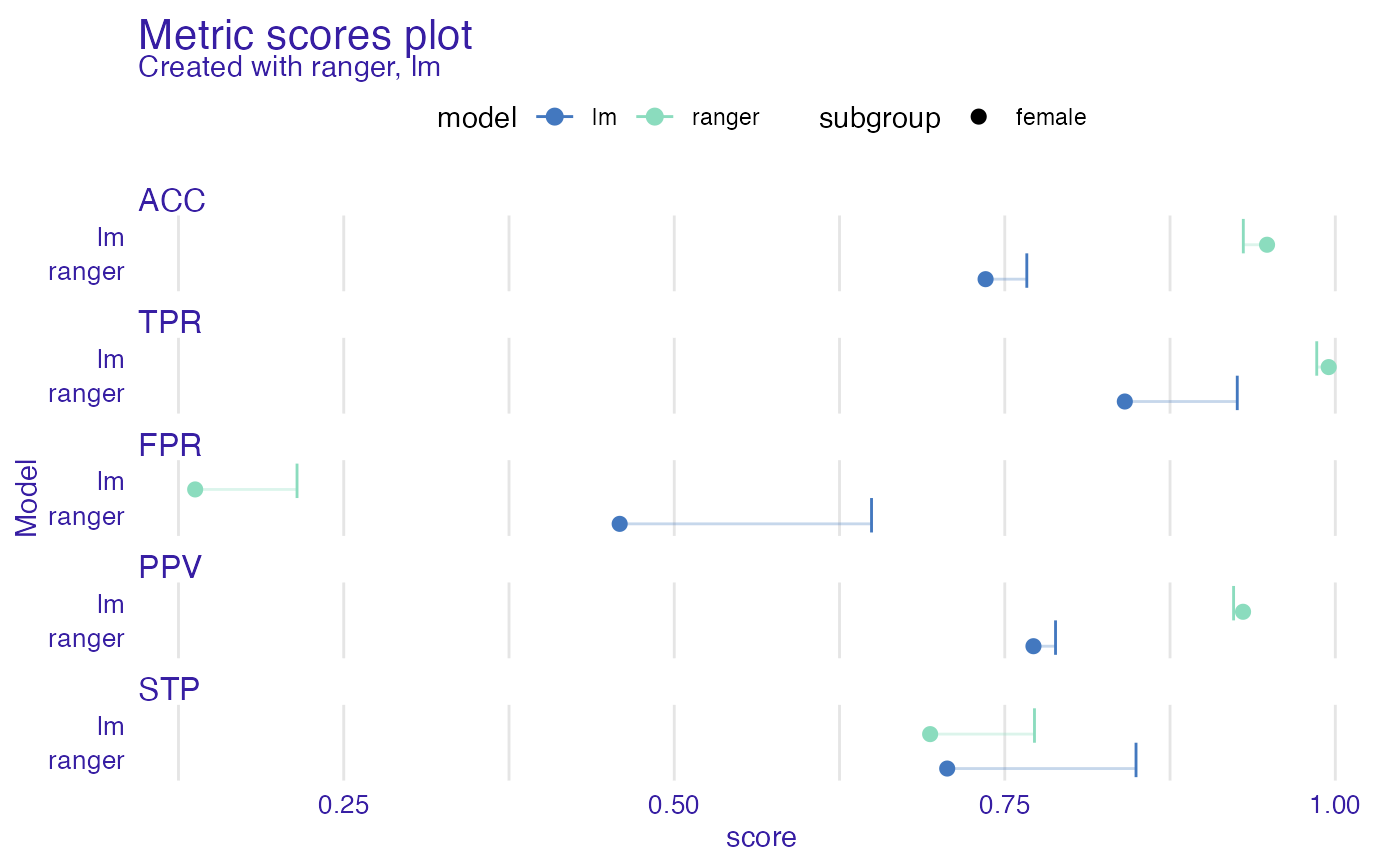
ms <- metric_scores(fobject, fairness_metrics = c("ACC", "TPR", "PPV", "FPR", "STP"))
plot(ms)
# \donttest{
rf_model <- ranger::ranger(Risk ~ .,
data = german,
probability = TRUE,
num.trees = 200
)
explainer_rf <- DALEX::explain(rf_model, data = german[, -1], y = y_numeric)
#> Preparation of a new explainer is initiated
#> -> model label : ranger ( default )
#> -> data : 1000 rows 9 cols
#> -> target variable : 1000 values
#> -> predict function : yhat.ranger will be used ( default )
#> -> predicted values : No value for predict function target column. ( default )
#> -> model_info : package ranger , ver. 0.13.1 , task classification ( default )
#> -> predicted values : numerical, min = 0.07945635 , mean = 0.6984925 , max = 0.9967857
#> -> residual function : difference between y and yhat ( default )
#> -> residuals : numerical, min = -0.7482123 , mean = 0.001507462 , max = 0.6149175
#> A new explainer has been created!
fobject <- fairness_check(explainer_rf, fobject)
#> Creating fairness classification object
#> -> Privileged subgroup : character ( from first fairness object )
#> -> Protected variable : factor ( from first fairness object )
#> -> Cutoff values for explainers : 0.5 ( for all subgroups )
#> -> Fairness objects : 1 object ( compatible )
#> -> Checking explainers : 2 in total ( compatible )
#> -> Metric calculation : 13/13 metrics calculated for all models
#> Fairness object created succesfully
ms <- metric_scores(fobject, fairness_metrics = c("ACC", "TPR", "PPV", "FPR", "STP"))
plot(ms)
 # }
# }