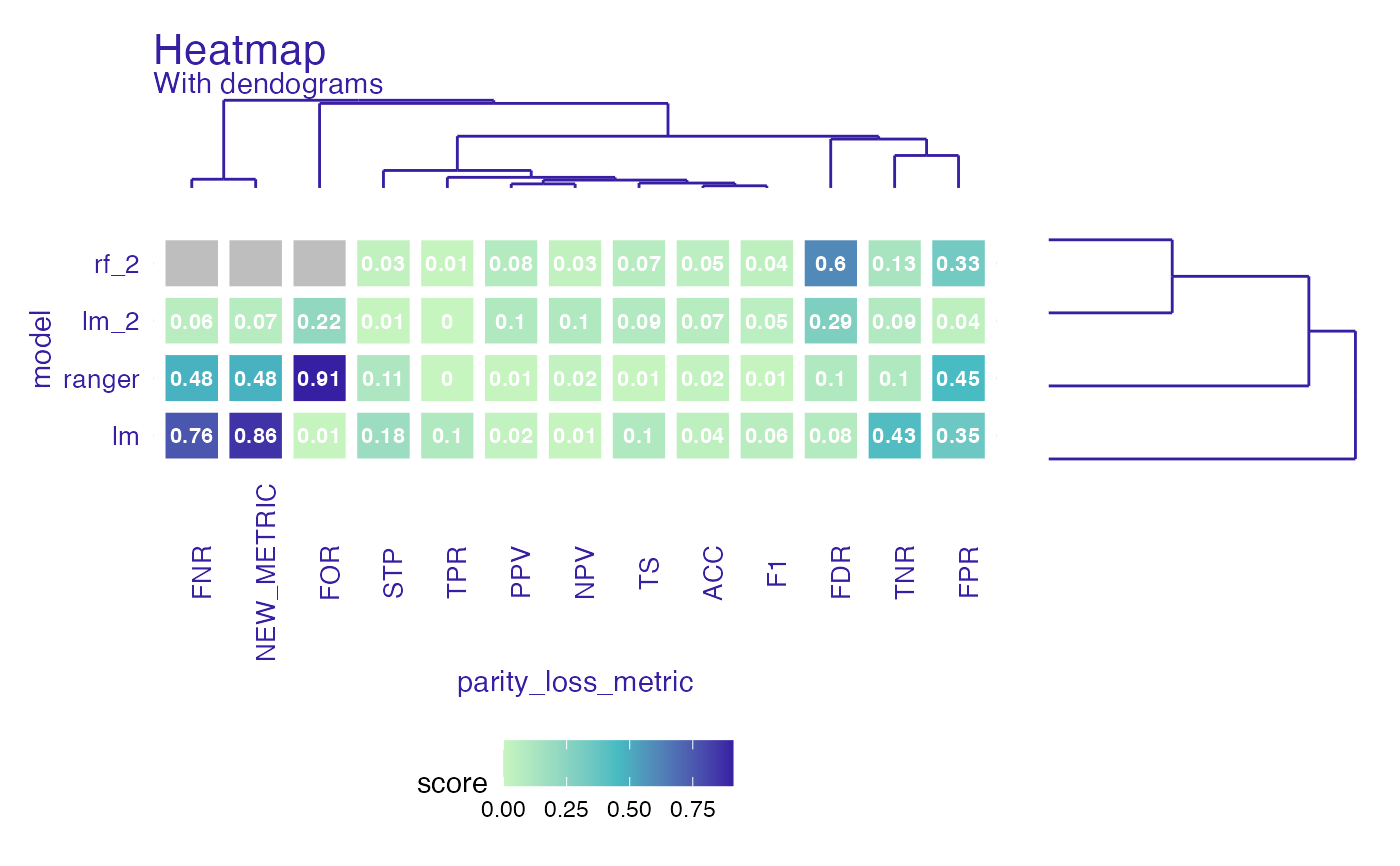
Create fairness_heatmap object to compare both models and metrics.
If parameter scale is set to TRUE metrics will be scaled to median = 0 and sd = 1.
If NA's appear heatmap will still plot, but with gray area where NA's were.
fairness_heatmap(x, scale = FALSE)Arguments
| x | object of class |
|---|---|
| scale | logical, if codeTRUE metrics will be scaled to mean 0 and sd 1. Default |
Value
fairness_heatmap object.
It is a list with following fields:
heatmap_data -
data.framewith information about score for model and parity loss metricmatrix_model - matrix used in dendogram plots
scale - logical parameter passed to
fairness_heatmaplabel - character, vector of model labels
Examples
data("german")

y_numeric <- as.numeric(german$Risk) - 1

lm_model <- glm(Risk ~ .,
  data = german,
  family = binomial(link = "logit")
)

rf_model <- ranger::ranger(Risk ~ .,
  data = german,
  probability = TRUE,
  num.trees = 200,
  num.threads = 1
)

explainer_lm <- DALEX::explain(lm_model, data = german[, -1], y = y_numeric)
#> Preparation of a new explainer is initiated
#>   -> model label       :  lm  (  default  )
#>   -> data              :  1000  rows  9  cols
#>   -> target variable   :  1000  values
#>   -> predict function  :  yhat.glm  will be used (  default  )
#>   -> predicted values  :  No value for predict function target column. (  default  )
#>   -> model_info        :  package stats , ver. 4.1.1 , task classification (  default  )
#>   -> predicted values  :  numerical, min =  0.1369187 , mean =  0.7 , max =  0.9832426
#>   -> residual function :  difference between y and yhat (  default  )
#>   -> residuals         :  numerical, min =  -0.9572803 , mean =  1.940006e-17 , max =  0.8283475
#>   A new explainer has been created!
explainer_rf <- DALEX::explain(rf_model, data = german[, -1], y = y_numeric)
#> Preparation of a new explainer is initiated
#>   -> model label       :  ranger  (  default  )
#>   -> data              :  1000  rows  9  cols
#>   -> target variable   :  1000  values
#>   -> predict function  :  yhat.ranger  will be used (  default  )
#>   -> predicted values  :  No value for predict function target column. (  default  )
#>   -> model_info        :  package ranger , ver. 0.13.1 , task classification (  default  )
#>   -> predicted values  :  numerical, min =  0.05022024 , mean =  0.6969863 , max =  0.9981746
#>   -> residual function :  difference between y and yhat (  default  )
#>   -> residuals         :  numerical, min =  -0.7025734 , mean =  0.003013703 , max =  0.6601389
#>   A new explainer has been created!

fobject <- fairness_check(explainer_lm, explainer_rf,
  protected = german$Sex,
  privileged = "male"
)
#> Creating fairness classification object
#> -> Privileged subgroup		: character ( Ok  )
#> -> Protected variable		: factor ( Ok  )
#> -> Cutoff values for explainers	: 0.5 ( for all subgroups )
#> -> Fairness objects		: 0 objects
#> -> Checking explainers		: 2 in total (  compatible  )
#> -> Metric calculation		: 13/13 metrics calculated for all models
#>  Fairness object created succesfully

# same explainers with different cutoffs for female
fobject <- fairness_check(explainer_lm, explainer_rf, fobject,
  protected = german$Sex,
  privileged = "male",
  cutoff = list(female = 0.4),
  label = c("lm_2", "rf_2")
)
#> Creating fairness classification object
#> -> Privileged subgroup		: character ( Ok  )
#> -> Protected variable		: factor ( Ok  )
#> -> Cutoff values for explainers	: female: 0.4, male: 0.5
#> -> Fairness objects		: 1 object (  compatible  )
#> -> Checking explainers		: 4 in total (  compatible  )
#> -> Metric calculation		: 10/13 metrics calculated for all models ( 3 NA created )
#>  Fairness object created succesfully


fh <- fairness_heatmap(fobject)

plot(fh)
#> Warning: Removed 3 rows containing missing values (geom_text).