This is an experimental approach. Please have it in mind when using it. Fairness_check_regression enables to check fairness in regression models. It uses so-called probabilistic classification to approximate fairness measures. The metrics in use are independence, separation, and sufficiency. The intuition behind this method is that the closer to 1 the metrics are the better. When all metrics are close to 1 then it means that from the perspective of a predictive model there are no meaningful differences between subgroups.
fairness_check_regression(
  x,
  ...,
  protected = NULL,
  privileged = NULL,
  label = NULL,
  epsilon = NULL,
  verbose = TRUE,
  colorize = TRUE
)
Arguments
| x | object created with |
|---|---|
| ... | possibly more objects created with |
| protected | factor, protected variable (also called sensitive attribute), containing privileged and unprivileged groups |
| privileged | factor/character, one value of |
| label | character, vector of labels to be assigned for explainers, default is explainer label. |
| epsilon | numeric, boundary for fairness checking, lowest/maximal acceptable metric values for unprivileged. Default value is 0.8. |
| verbose | logical, whether to print information about creation of fairness object |
| colorize | logical, whether to print information in color |
Details
Sometimes during metric calculation faze approximation algorithms (logistic regression models) might not coverage properly. This might indicate that the membership to subgroups has strong predictive power.
References
Steinberg, Daniel & Reid, Alistair & O'Callaghan, Simon. (2020). Fairness Measures for Regression via Probabilistic Classification. - https://arxiv.org/pdf/2001.06089.pdf
Examples
set.seed(123)
data <- data.frame(
x = c(rnorm(500, 500, 100), rnorm(500, 400, 200)),
pop = c(rep("A", 500), rep("B", 500))
)
data$y <- rnorm(length(data$x), 1.5 * data$x, 100)
# create model
model <- lm(y ~ ., data = data)
# create explainer
exp <- DALEX::explain(model, data = data, y = data$y)
#> Preparation of a new explainer is initiated
#> -> model label : lm ( default )
#> -> data : 1000 rows 3 cols
#> -> target variable : 1000 values
#> -> predict function : yhat.lm will be used ( default )
#> -> predicted values : No value for predict function target column. ( default )
#> -> model_info : package stats , ver. 4.1.1 , task regression ( default )
#> -> predicted values : numerical, min = -269.546 , mean = 681.4906 , max = 1444.562
#> -> residual function : difference between y and yhat ( default )
#> -> residuals : numerical, min = -302.6659 , mean = -9.167582e-14 , max = 332.7938
#> A new explainer has been created!
# create fobject
fobject <- fairness_check_regression(exp, protected = data$pop, privileged = "A")
#> Creating fairness regression object
#> -> Privileged subgroup : character ( Ok )
#> -> Protected variable : factor ( changed from character )
#> -> Fairness objects : 0 objects
#> -> Checking explainers : 1 in total ( compatible )
#> -> Metric calculation : 3/3 metrics calculated for all models
#> Fairness regression object created succesfully
#>
# results
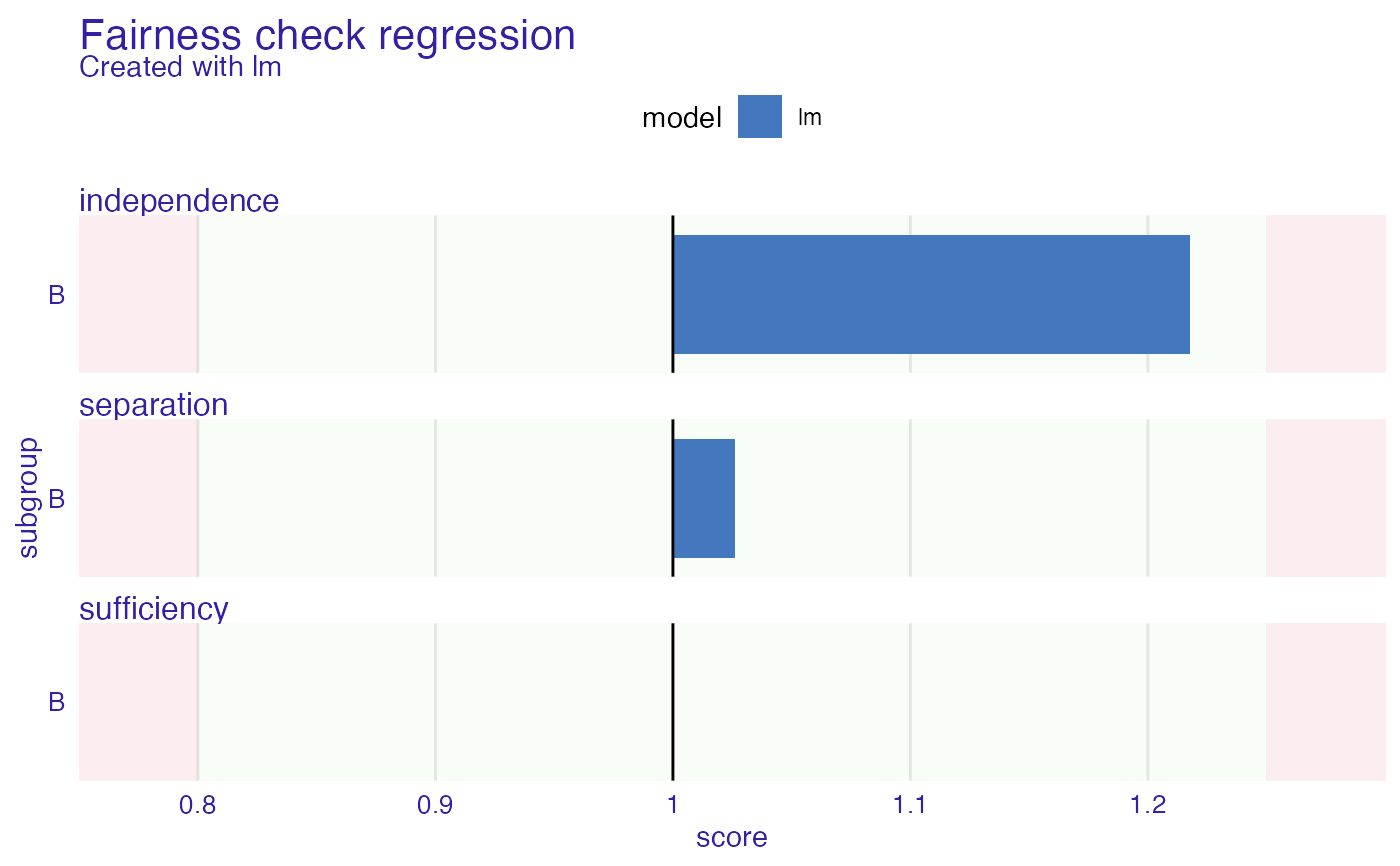
fobject
#>
#> Fairness check regression for models: lm
#>
#> lm passes 3/3 metrics
#> Total loss: 0.243362
#>
plot(fobject)
 # \donttest{
model_ranger <- ranger::ranger(y ~ ., data = data, seed = 123)
exp2 <- DALEX::explain(model_ranger, data = data, y = data$y)
#> Preparation of a new explainer is initiated
#> -> model label : ranger ( default )
#> -> data : 1000 rows 3 cols
#> -> target variable : 1000 values
#> -> predict function : yhat.ranger will be used ( default )
#> -> predicted values : No value for predict function target column. ( default )
#> -> model_info : package ranger , ver. 0.13.1 , task regression ( default )
#> -> predicted values : numerical, min = 210.6774 , mean = 681.3779 , max = 987.8878
#> -> residual function : difference between y and yhat ( default )
#> -> residuals : numerical, min = -668.0995 , mean = 0.1126996 , max = 629.5469
#> A new explainer has been created!
fobject <- fairness_check_regression(exp2, fobject)
#> Creating fairness regression object
#> -> Privileged subgroup : character ( from first fairness object )
#> -> Protected variable : factor ( from first fairness object )
#> -> Fairness objects : 1 object ( compatible )
#> -> Checking explainers : 2 in total ( compatible )
#> -> Metric calculation : 3/3 metrics calculated for all models
#> Fairness regression object created succesfully
#>
# results
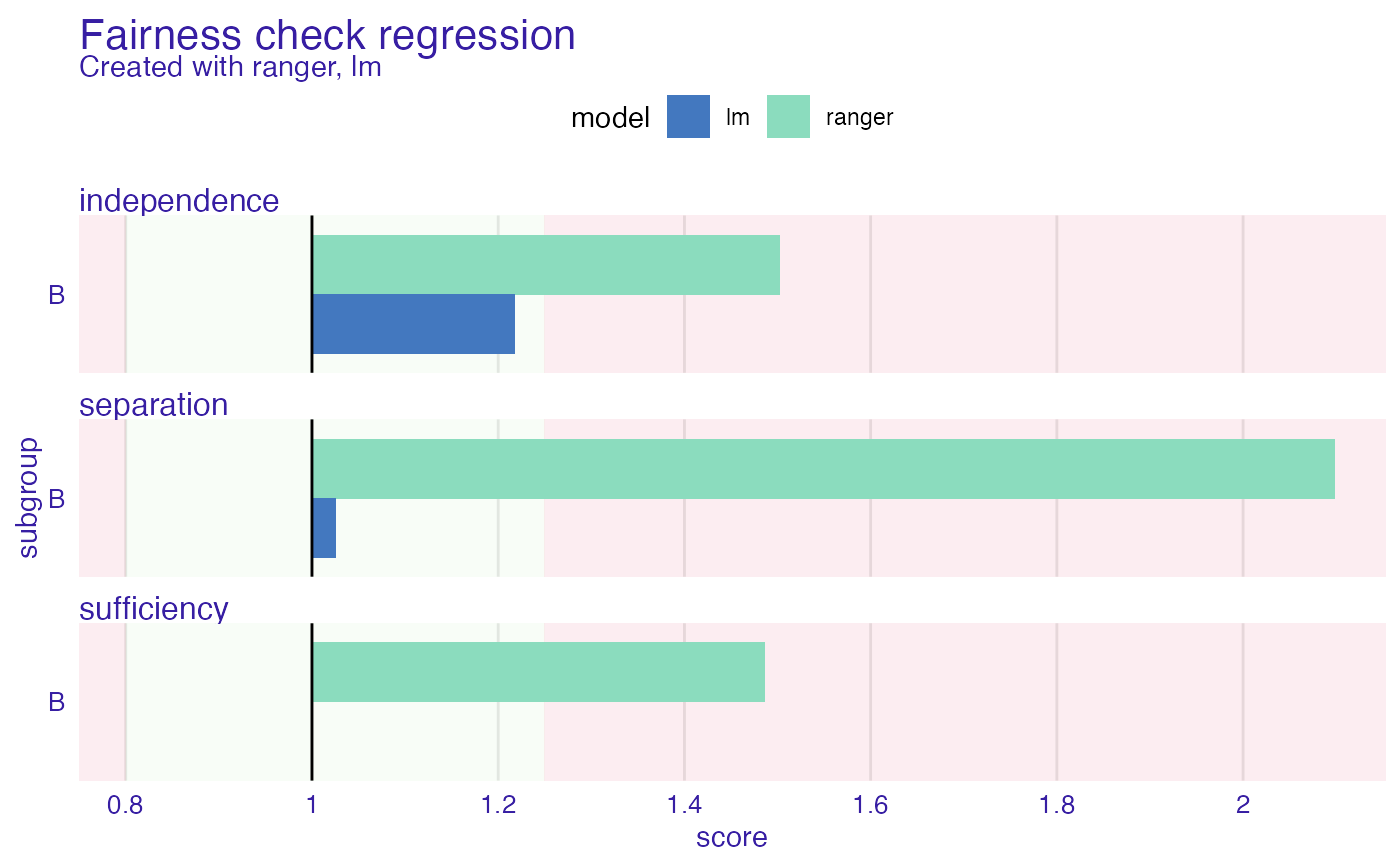
fobject
#>
#> Fairness check regression for models: ranger, lm
#>
#> ranger passes 0/3 metrics
#> Total loss: 2.086092
#>
#> lm passes 3/3 metrics
#> Total loss: 0.243362
#>
plot(fobject)
# \donttest{
model_ranger <- ranger::ranger(y ~ ., data = data, seed = 123)
exp2 <- DALEX::explain(model_ranger, data = data, y = data$y)
#> Preparation of a new explainer is initiated
#> -> model label : ranger ( default )
#> -> data : 1000 rows 3 cols
#> -> target variable : 1000 values
#> -> predict function : yhat.ranger will be used ( default )
#> -> predicted values : No value for predict function target column. ( default )
#> -> model_info : package ranger , ver. 0.13.1 , task regression ( default )
#> -> predicted values : numerical, min = 210.6774 , mean = 681.3779 , max = 987.8878
#> -> residual function : difference between y and yhat ( default )
#> -> residuals : numerical, min = -668.0995 , mean = 0.1126996 , max = 629.5469
#> A new explainer has been created!
fobject <- fairness_check_regression(exp2, fobject)
#> Creating fairness regression object
#> -> Privileged subgroup : character ( from first fairness object )
#> -> Protected variable : factor ( from first fairness object )
#> -> Fairness objects : 1 object ( compatible )
#> -> Checking explainers : 2 in total ( compatible )
#> -> Metric calculation : 3/3 metrics calculated for all models
#> Fairness regression object created succesfully
#>
# results
fobject
#>
#> Fairness check regression for models: ranger, lm
#>
#> ranger passes 0/3 metrics
#> Total loss: 2.086092
#>
#> lm passes 3/3 metrics
#> Total loss: 0.243362
#>
plot(fobject)
 # }
# }