Extracts metrics from metric_data from fairness object.
It allows to visualize and compare parity loss of chosen metric values across all models.
choose_metric(x, fairness_metric = "FPR")Arguments
| x | object of class |
|---|---|
| fairness_metric |
|
Value
chosen_metric object
It is a list with following fields:
parity_loss_metric_data
data.framewith columns: parity_loss_metric and labelmetric chosen metric
label character, vector of model labels
Examples
data("german")
y_numeric <- as.numeric(german$Risk) - 1
lm_model <- glm(Risk ~ .,
data = german,
family = binomial(link = "logit")
)
explainer_lm <- DALEX::explain(lm_model, data = german[, -1], y = y_numeric)
#> Preparation of a new explainer is initiated
#> -> model label : lm ( default )
#> -> data : 1000 rows 9 cols
#> -> target variable : 1000 values
#> -> predict function : yhat.glm will be used ( default )
#> -> predicted values : No value for predict function target column. ( default )
#> -> model_info : package stats , ver. 4.1.1 , task classification ( default )
#> -> predicted values : numerical, min = 0.1369187 , mean = 0.7 , max = 0.9832426
#> -> residual function : difference between y and yhat ( default )
#> -> residuals : numerical, min = -0.9572803 , mean = 1.940006e-17 , max = 0.8283475
#> A new explainer has been created!
fobject <- fairness_check(explainer_lm,
protected = german$Sex,
privileged = "male"
)
#> Creating fairness classification object
#> -> Privileged subgroup : character ( Ok )
#> -> Protected variable : factor ( Ok )
#> -> Cutoff values for explainers : 0.5 ( for all subgroups )
#> -> Fairness objects : 0 objects
#> -> Checking explainers : 1 in total ( compatible )
#> -> Metric calculation : 13/13 metrics calculated for all models
#> Fairness object created succesfully
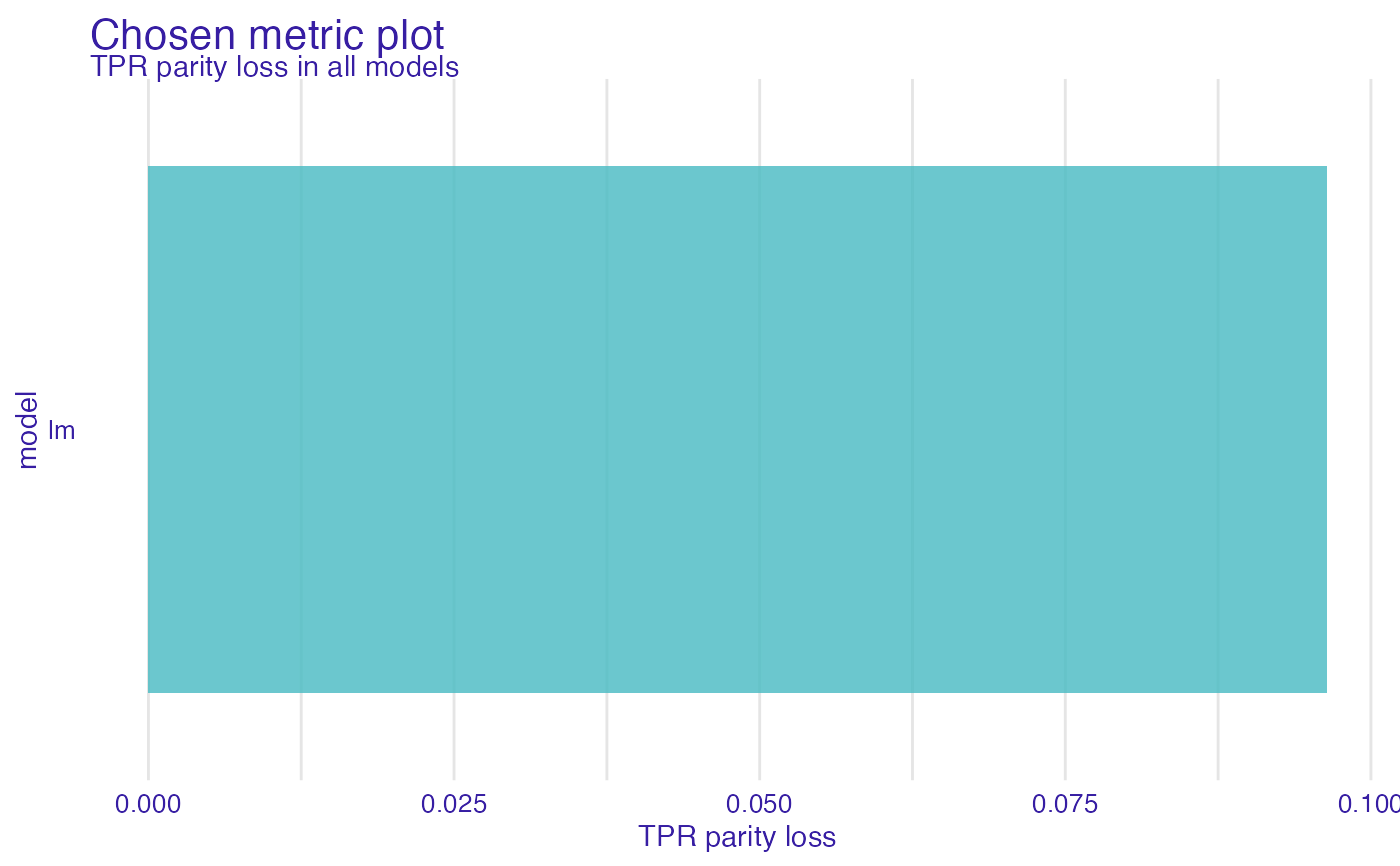
cm <- choose_metric(fobject, "TPR")
plot(cm)
 # \donttest{
rf_model <- ranger::ranger(Risk ~ .,
data = german,
probability = TRUE,
num.trees = 200
)
explainer_rf <- DALEX::explain(rf_model, data = german[, -1], y = y_numeric)
#> Preparation of a new explainer is initiated
#> -> model label : ranger ( default )
#> -> data : 1000 rows 9 cols
#> -> target variable : 1000 values
#> -> predict function : yhat.ranger will be used ( default )
#> -> predicted values : No value for predict function target column. ( default )
#> -> model_info : package ranger , ver. 0.13.1 , task classification ( default )
#> -> predicted values : numerical, min = 0.07711508 , mean = 0.6957104 , max = 0.9973333
#> -> residual function : difference between y and yhat ( default )
#> -> residuals : numerical, min = -0.7042262 , mean = 0.004289608 , max = 0.6651608
#> A new explainer has been created!
fobject <- fairness_check(explainer_rf, fobject)
#> Creating fairness classification object
#> -> Privileged subgroup : character ( from first fairness object )
#> -> Protected variable : factor ( from first fairness object )
#> -> Cutoff values for explainers : 0.5 ( for all subgroups )
#> -> Fairness objects : 1 object ( compatible )
#> -> Checking explainers : 2 in total ( compatible )
#> -> Metric calculation : 10/13 metrics calculated for all models ( 3 NA created )
#> Fairness object created succesfully
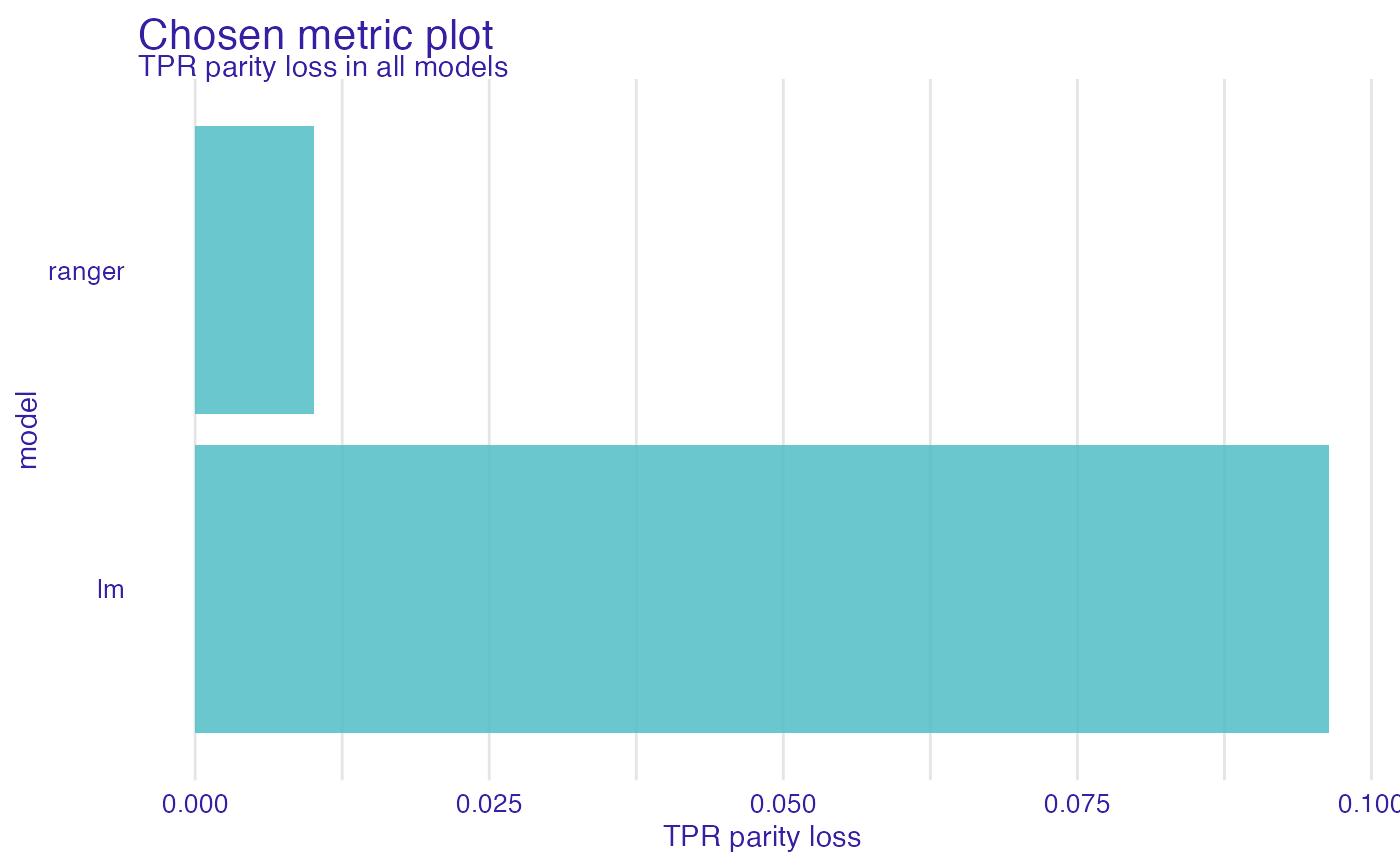
cm <- choose_metric(fobject, "TPR")
plot(cm)
# \donttest{
rf_model <- ranger::ranger(Risk ~ .,
data = german,
probability = TRUE,
num.trees = 200
)
explainer_rf <- DALEX::explain(rf_model, data = german[, -1], y = y_numeric)
#> Preparation of a new explainer is initiated
#> -> model label : ranger ( default )
#> -> data : 1000 rows 9 cols
#> -> target variable : 1000 values
#> -> predict function : yhat.ranger will be used ( default )
#> -> predicted values : No value for predict function target column. ( default )
#> -> model_info : package ranger , ver. 0.13.1 , task classification ( default )
#> -> predicted values : numerical, min = 0.07711508 , mean = 0.6957104 , max = 0.9973333
#> -> residual function : difference between y and yhat ( default )
#> -> residuals : numerical, min = -0.7042262 , mean = 0.004289608 , max = 0.6651608
#> A new explainer has been created!
fobject <- fairness_check(explainer_rf, fobject)
#> Creating fairness classification object
#> -> Privileged subgroup : character ( from first fairness object )
#> -> Protected variable : factor ( from first fairness object )
#> -> Cutoff values for explainers : 0.5 ( for all subgroups )
#> -> Fairness objects : 1 object ( compatible )
#> -> Checking explainers : 2 in total ( compatible )
#> -> Metric calculation : 10/13 metrics calculated for all models ( 3 NA created )
#> Fairness object created succesfully
cm <- choose_metric(fobject, "TPR")
plot(cm)
 # }
# }