Calculate Model Drift for comparison of models trained on new/old data
This function calculates differences between PDP curves calculated for new/old models
calculate_model_drift(model_old, model_new, data_new, y_new,
  predict_function = predict, max_obs = 100, scale = sd(y_new, na.rm
  = TRUE))
Arguments
| model_old | model created on historical / `old`data |
|---|---|
| model_new | model created on current / `new`data |
| data_new | data frame with current / `new` data |
| y_new | true values of target variable for current / `new` data |
| predict_function | function that takes two arguments: model and new data and returns numeric vector with predictions, by default it's `predict` |
| max_obs | if negative, them all observations are used for calculation of PDP, is positive, then only `max_obs` are used for calculation of PDP |
| scale | scale parameter for calculation of scaled drift |
Value
an object of a class `model_drift` (data.frame) with distances calculated based on Partial Dependency Plots
Examples
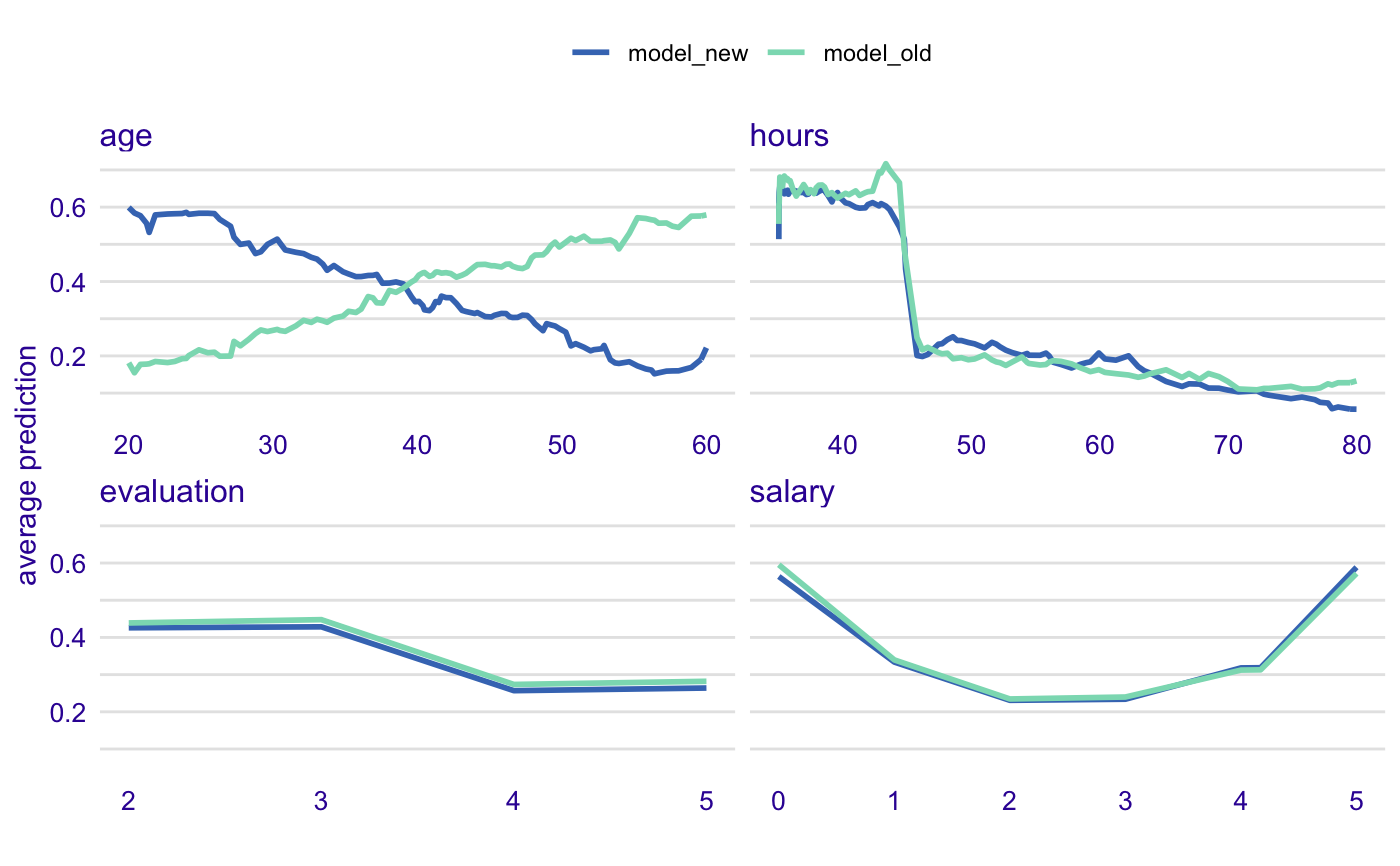
library("DALEX") model_old <- lm(m2.price ~ ., data = apartments) model_new <- lm(m2.price ~ ., data = apartments_test[1:1000,]) calculate_model_drift(model_old, model_new, apartments_test[1:1000,], apartments_test[1:1000,]$m2.price)#> Variable Shift Scaled #> ----------------------------------------------- #> floor 138.34 15.5 . #> no.rooms 151.07 16.9 . #> surface 111.21 12.5 . #> m2.price 153.56 17.2 . #> construction.year 154.71 17.3 .library("ranger") predict_function <- function(m,x,...) predict(m, x, ...)$predictions model_old <- ranger(m2.price ~ ., data = apartments) model_new <- ranger(m2.price ~ ., data = apartments_test) calculate_model_drift(model_old, model_new, apartments_test, apartments_test$m2.price, predict_function = predict_function)#> Variable Shift Scaled #> ----------------------------------------------- #> floor 87.95 9.8 #> no.rooms 34.66 3.8 #> surface 29.47 3.3 #> m2.price 63.14 7.0 #> construction.year 76.80 8.5# here we compare model created on male data # with model applied to female data # there is interaction with age, and it is detected here predict_function <- function(m,x,...) predict(m, x, ..., probability=TRUE)$predictions[,1] data_old = HR[HR$gender == "male", -1] data_new = HR[HR$gender == "female", -1] model_old <- ranger(status ~ ., data = data_old, probability=TRUE) model_new <- ranger(status ~ ., data = data_new, probability=TRUE) calculate_model_drift(model_old, model_new, HR_test, HR_test$status == "fired", predict_function = predict_function)#> Variable Shift Scaled #> ----------------------------------------------- #> salary 0.03 6.6 #> evaluation 0.04 8.1 #> age 0.26 53.3 *** #> hours 0.05 9.5# plot it library("ingredients")#> #>#> #> #>#> #> #>prof_old <- partial_dependency(model_old, data = data_new[1:500,], label = "model_old", predict_function = predict_function, grid_points = 101, variable_splits = NULL) prof_new <- partial_dependency(model_new, data = data_new[1:500,], label = "model_new", predict_function = predict_function, grid_points = 101, variable_splits = NULL) plot(prof_old, prof_new, color = "_label_")