Tables needed for lollipop plot
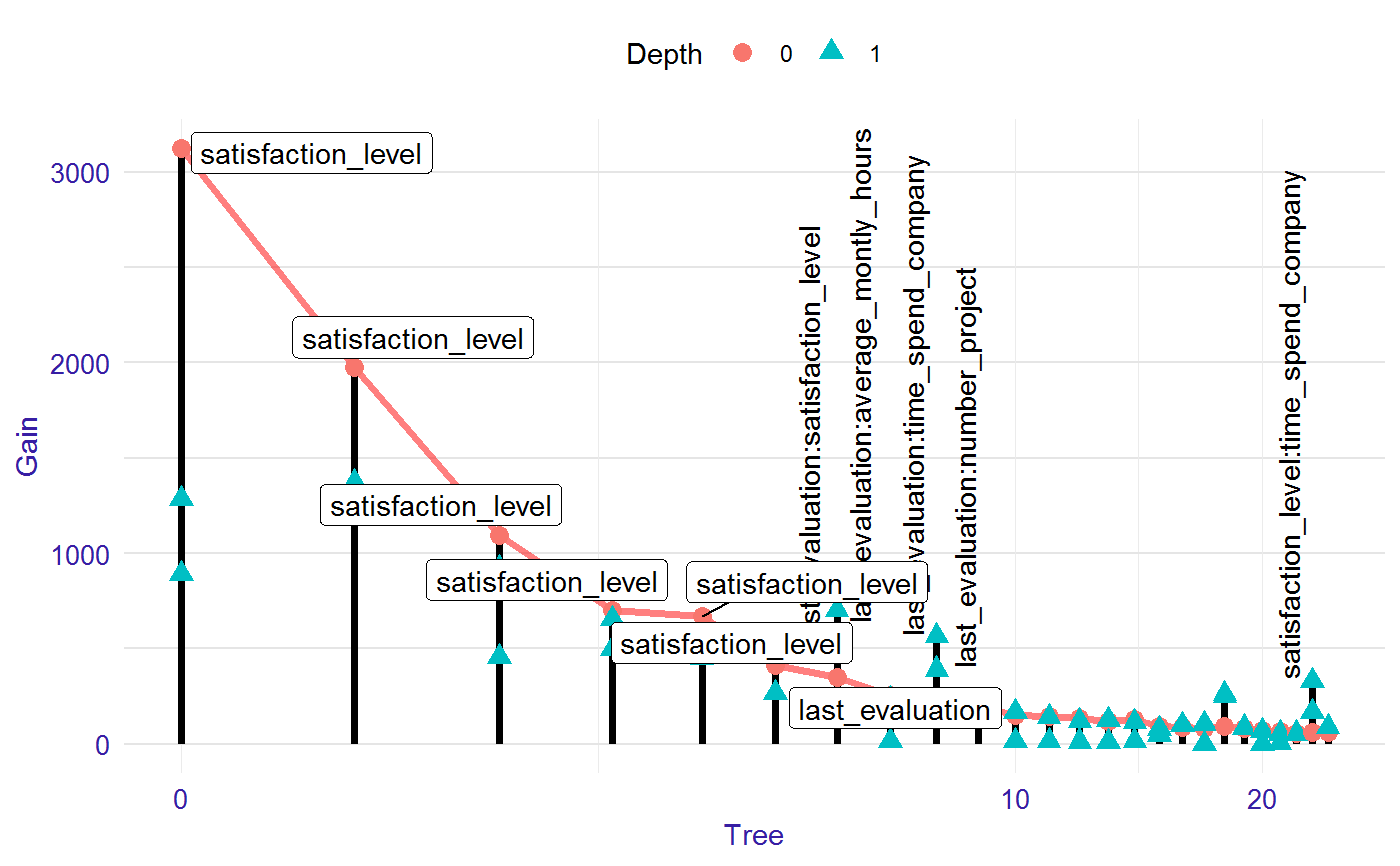
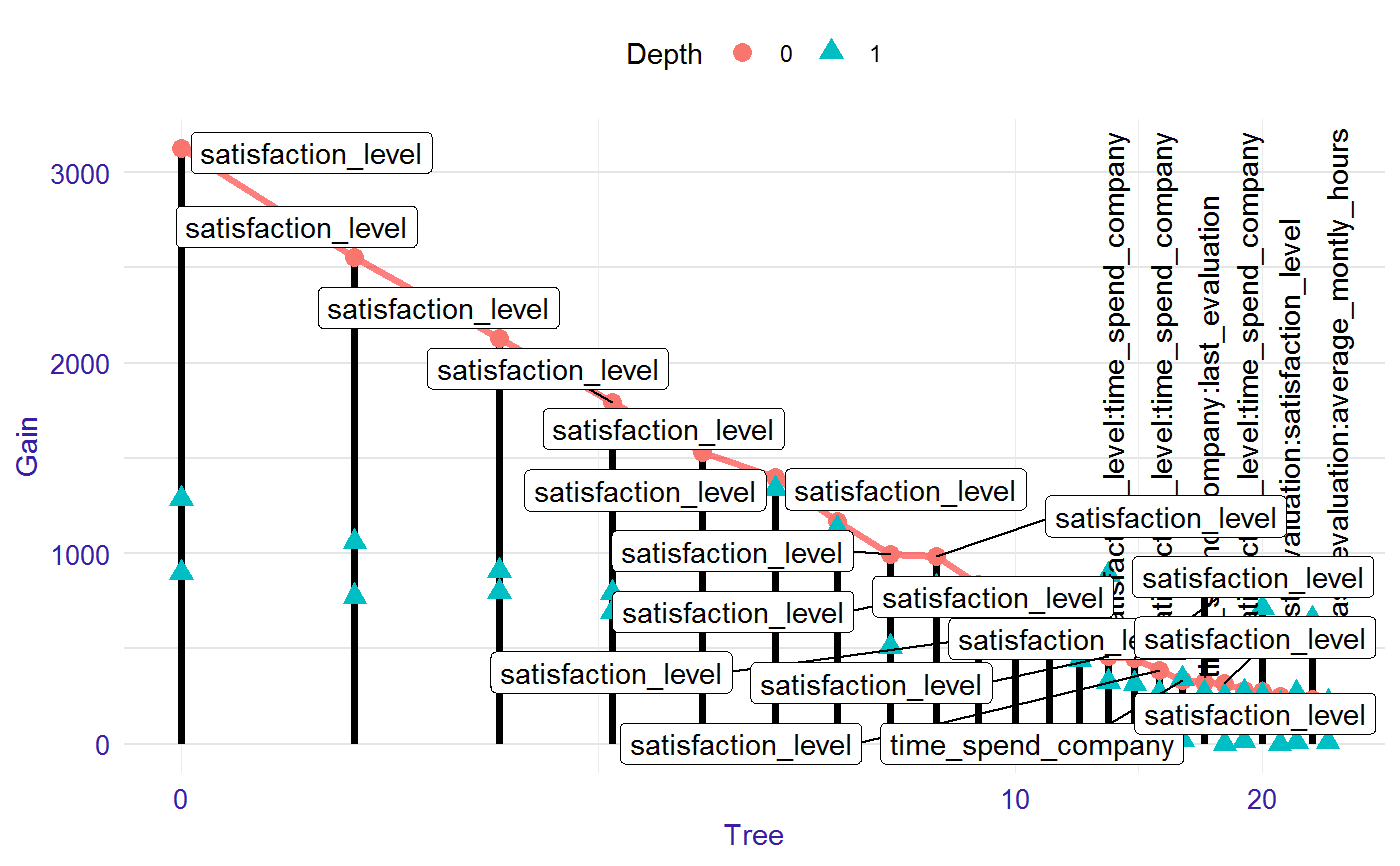
This function calculates two tables needed to generate lollipop plot, which visualise the model. The first table contains information about all nodes in the trees forming a model. It includes gain value, depth and ID of each nodes. The second table contains similarly information about roots in the trees.
lollipop(xgb_model, data)
Arguments
| xgb_model | a xgboost or lightgbm model. |
|---|---|
| data | a data table with data used to train the model. |
Value
an object of the lollipop class
Examples
library("EIX") library("Matrix") sm <- sparse.model.matrix(left ~ . - 1, data = HR_data) library("xgboost") param <- list(objective = "binary:logistic", max_depth = 2) xgb_model <- xgboost(sm, params = param, label = HR_data[, left] == 1, nrounds = 25, verbose = 0) lolli <- lollipop(xgb_model, sm) plot(lolli, labels = "topAll", log_scale = TRUE)library(lightgbm) train_data <- lgb.Dataset(sm, label = HR_data[, left] == 1) params <- list(objective = "binary", max_depth = 2) lgb_model <- lgb.train(params, train_data, 25) lolli <- lollipop(lgb_model, sm) plot(lolli, labels = "topAll", log_scale = TRUE)